
Credit
How many credits you have, what has been consuming them, and where to manage your plan and invoices.
Opening the page
- Click your avatar at the bottom of the left rail and choose Settings.
- Under ORGANIZATION, select Credit.
Switching between Organization and My credits
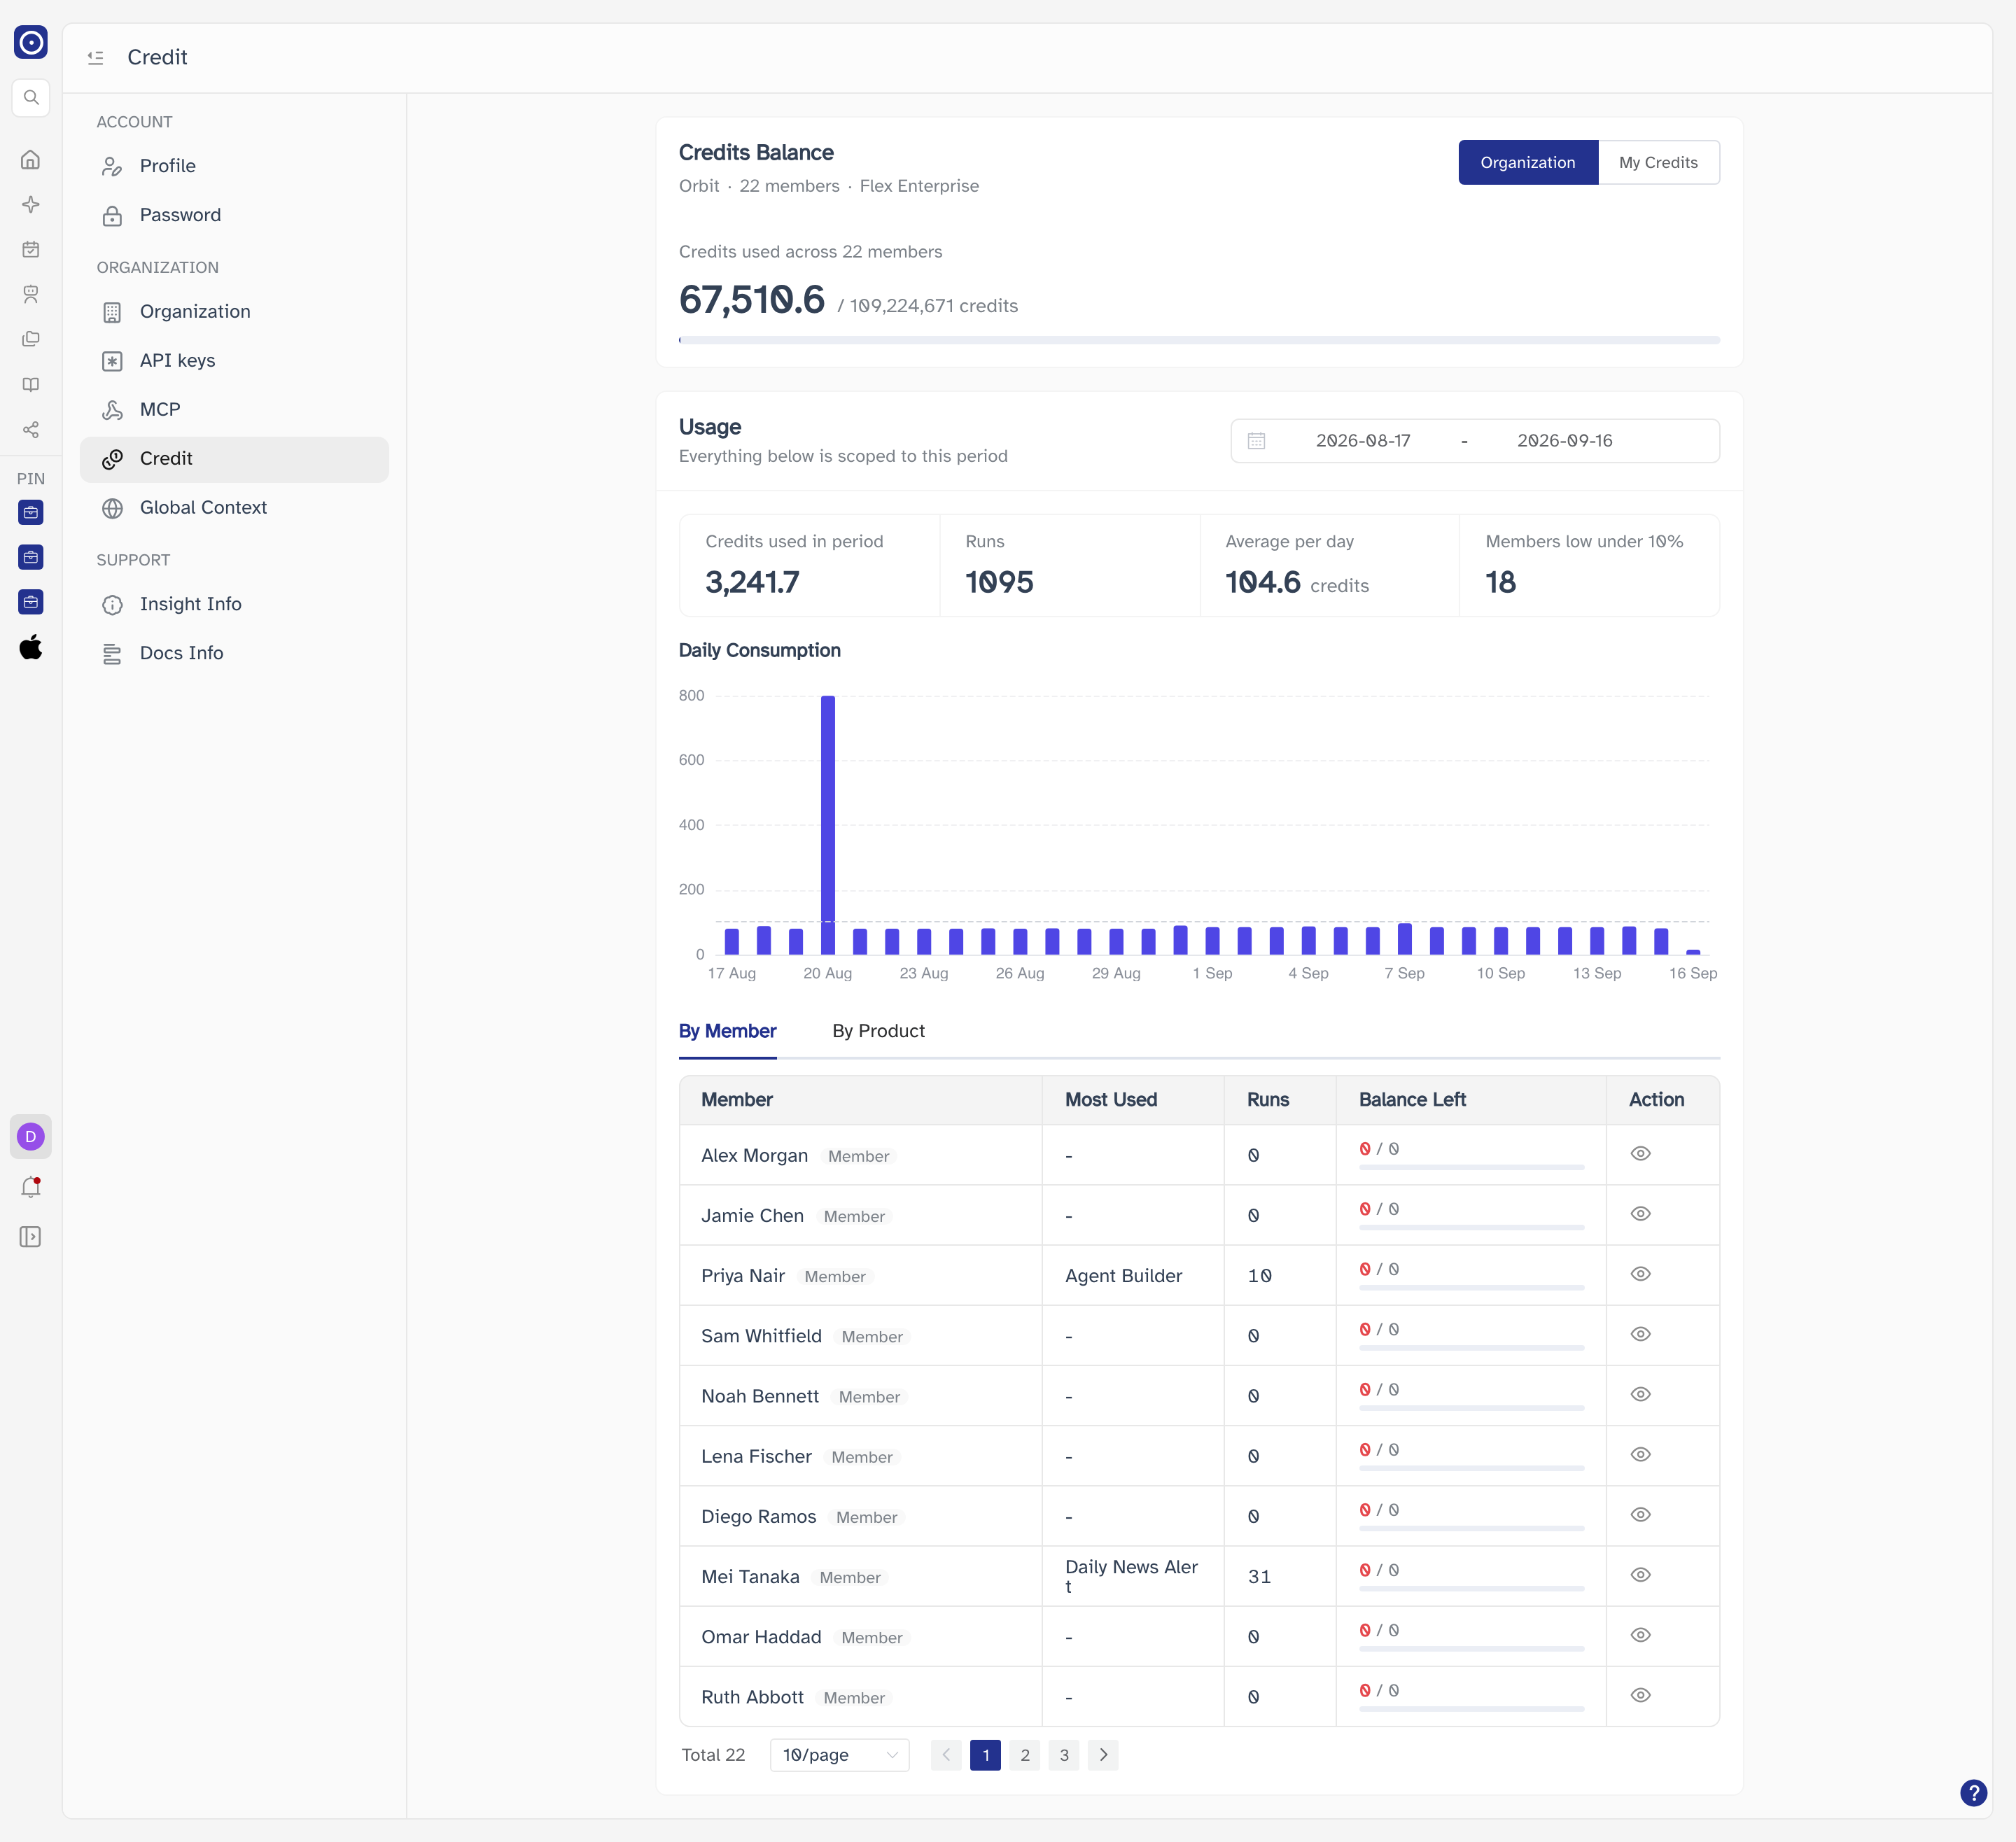
If you own the organisation, the toggle at the top right of the balance card switches between two views. The page rebuilds completely when you switch — the balance, the statistics, the chart, and the breakdown tables all change with it.
If you are not an organisation owner the toggle does not appear and you see your personal view only.
Organization
Credits and usage totalled across everyone in your organisation.
My credits
Just your own balance and consumption. This view also carries the subscription controls — Billing history and the plan buttons are here, not in the organisation view.
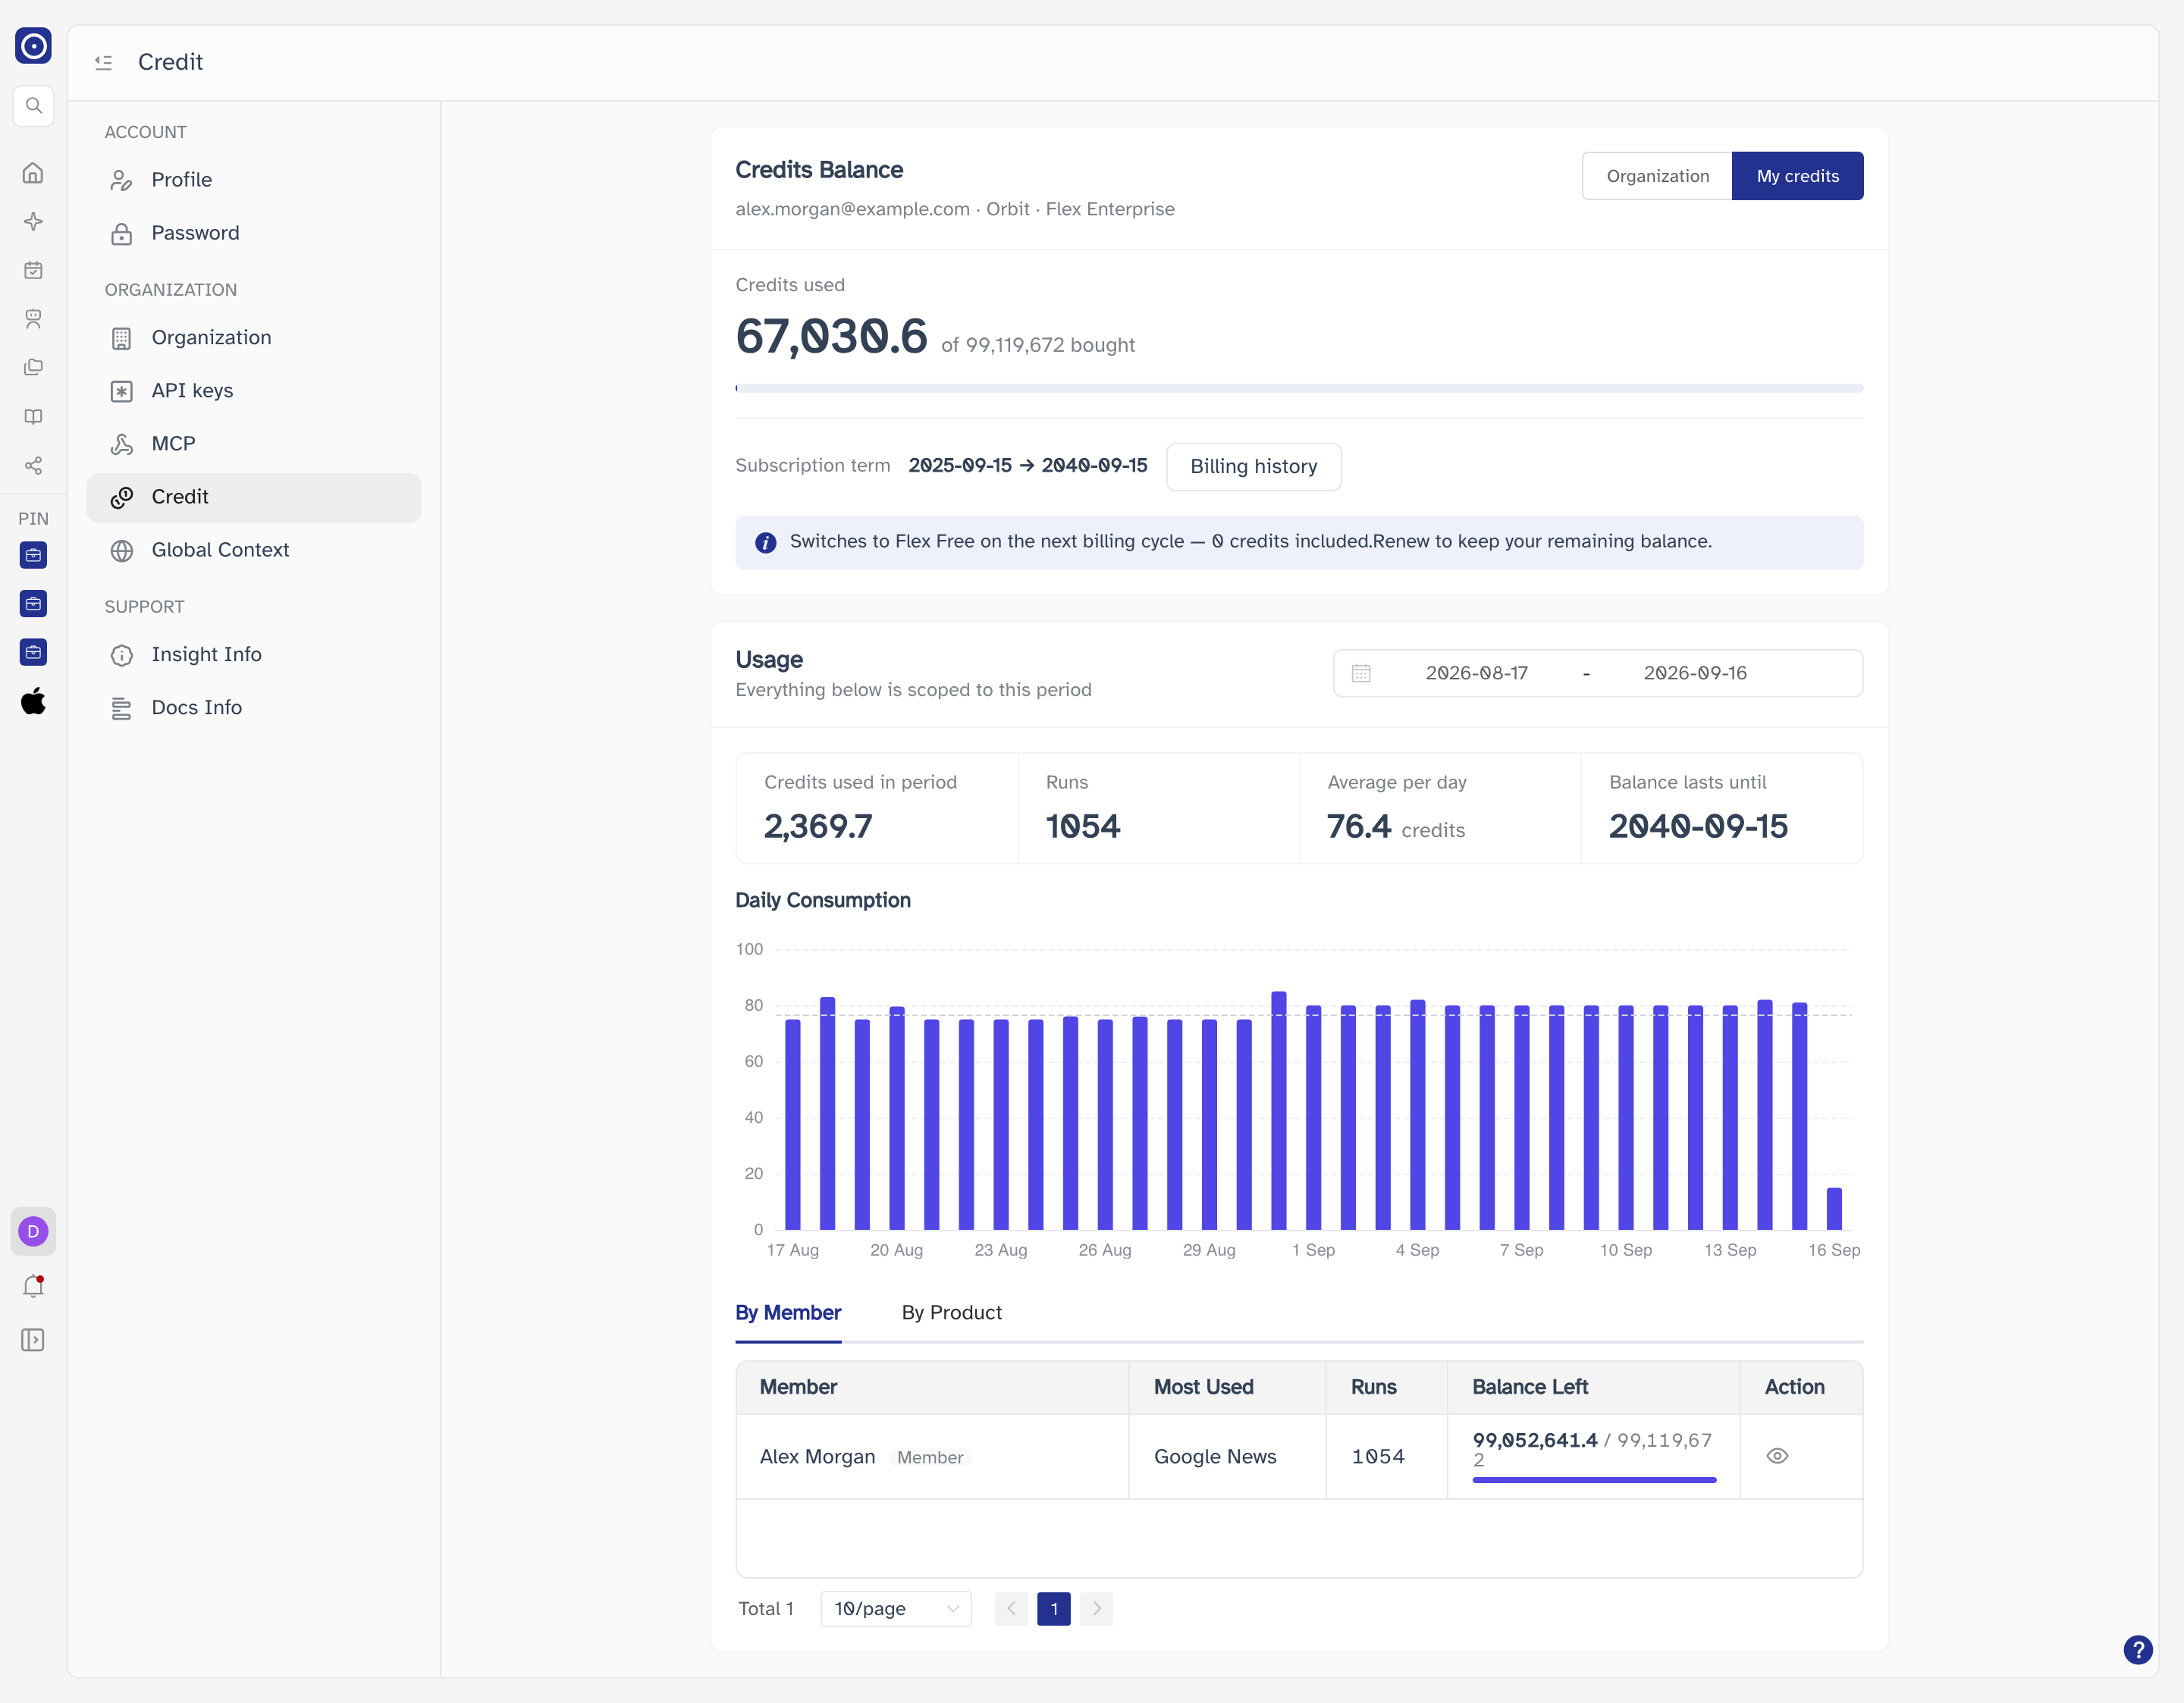
| Shown in | Organization | My credits |
|---|---|---|
| Balance headline | Credits used across all members | Your credits used of the amount bought |
| Fourth statistic | Members low under 10% | Balance lasts until |
| Subscription term | — | Start and end dates of the current period |
| Billing history | — | Available |
| By Member table | Every member of the organisation | Only you |
Credits Balance
The card shows how many credits have been used against how many are available, with a progress bar for the same figure. The subtitle identifies the account — your email, your organisation, and your plan.
| Indicator | What it means |
|---|---|
| Low balance | A tag next to Credits used when less than 10% of your credits remain, with the percentage left shown beside the totals. |
| Out of credits | A red banner when the balance reaches zero. New runs fail until the plan is renewed or more credits are added. |
| Next billing cycle | A banner naming the plan you move to at the next renewal and how many credits it includes. |
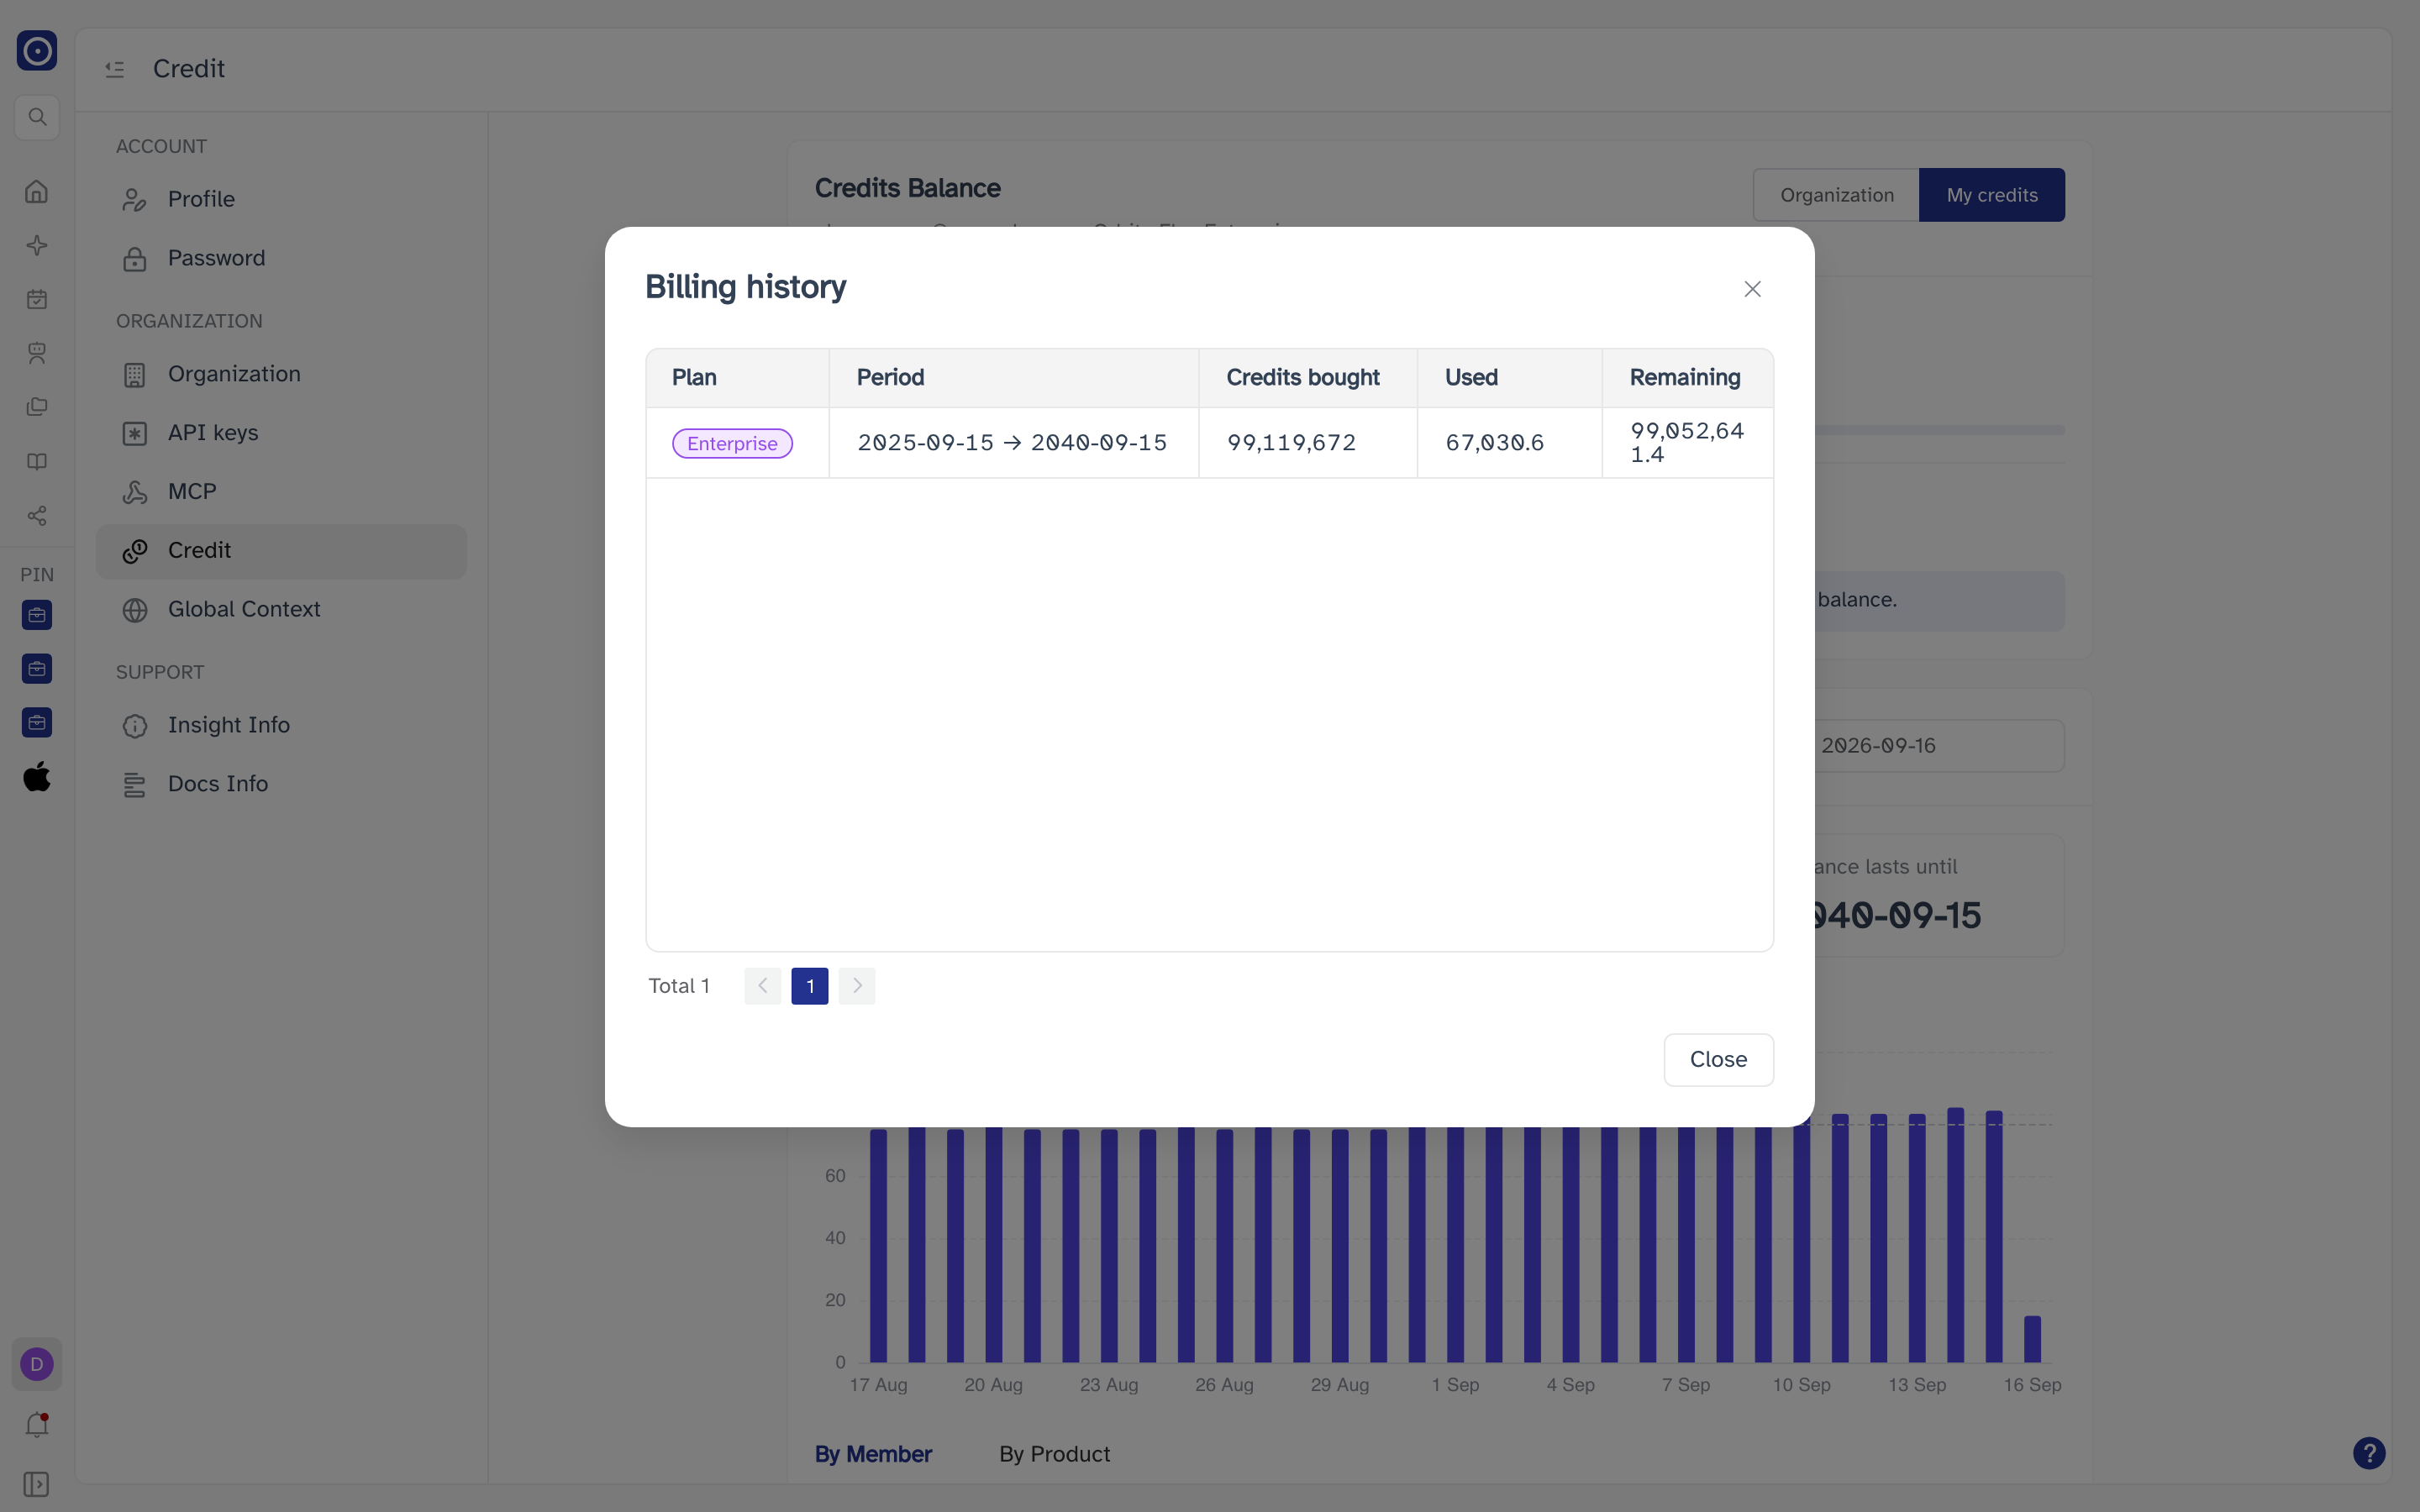
Billing history
Available in the My credits view, next to the subscription term. It opens a dialog listing each billing period you have had.
Plan controls
| Button | What it does |
|---|---|
| Manage Billing | Opens the external billing portal in a new tab, where you manage payment methods and billing details. |
| Switch Plan | Takes you to Pricing & plans to compare plans and change your subscription. |
| Unsubscribe | Starts cancelling the subscription from the next billing cycle. A confirmation dialog appears before anything changes. |
Usage
Everything below the balance card is scoped to the date range in the period picker. Change the range and the statistics, the chart, and both breakdown tables update together.
| Statistic | Meaning |
|---|---|
| Credits used in period | Total credits consumed within the selected dates. |
| Runs | How many times agents, chats, and other features were run. |
| Average per day | Credits used in the period divided by its length. |
| Members low under 10% | Organization view. How many people have less than 10% of their credits left. |
| Balance lasts until | My credits view. The date your balance runs out at the current rate. |
Daily Consumption
A bar per day across the selected period, so spikes are easy to spot. Hover a bar to read its exact value.
Breakdown: By Member and By Product
The tabs below the chart split the same usage two ways. Click a tab to switch; the table underneath is replaced.
By Member
One row per person, visible in the Organization view screenshot above.
| Column | Meaning |
|---|---|
| Member | The person's name and their role in the organisation. |
| Most Used | The feature that consumed most of their credits, or - if they have not run anything. |
| Runs | How many runs they performed in the period. |
| Balance Left | Their remaining credits against their allocation, with a bar. Turns red when the balance is low. |
| Action | The eye icon opens their detail — see below. |
By Product
The same consumption grouped by the feature that used it.
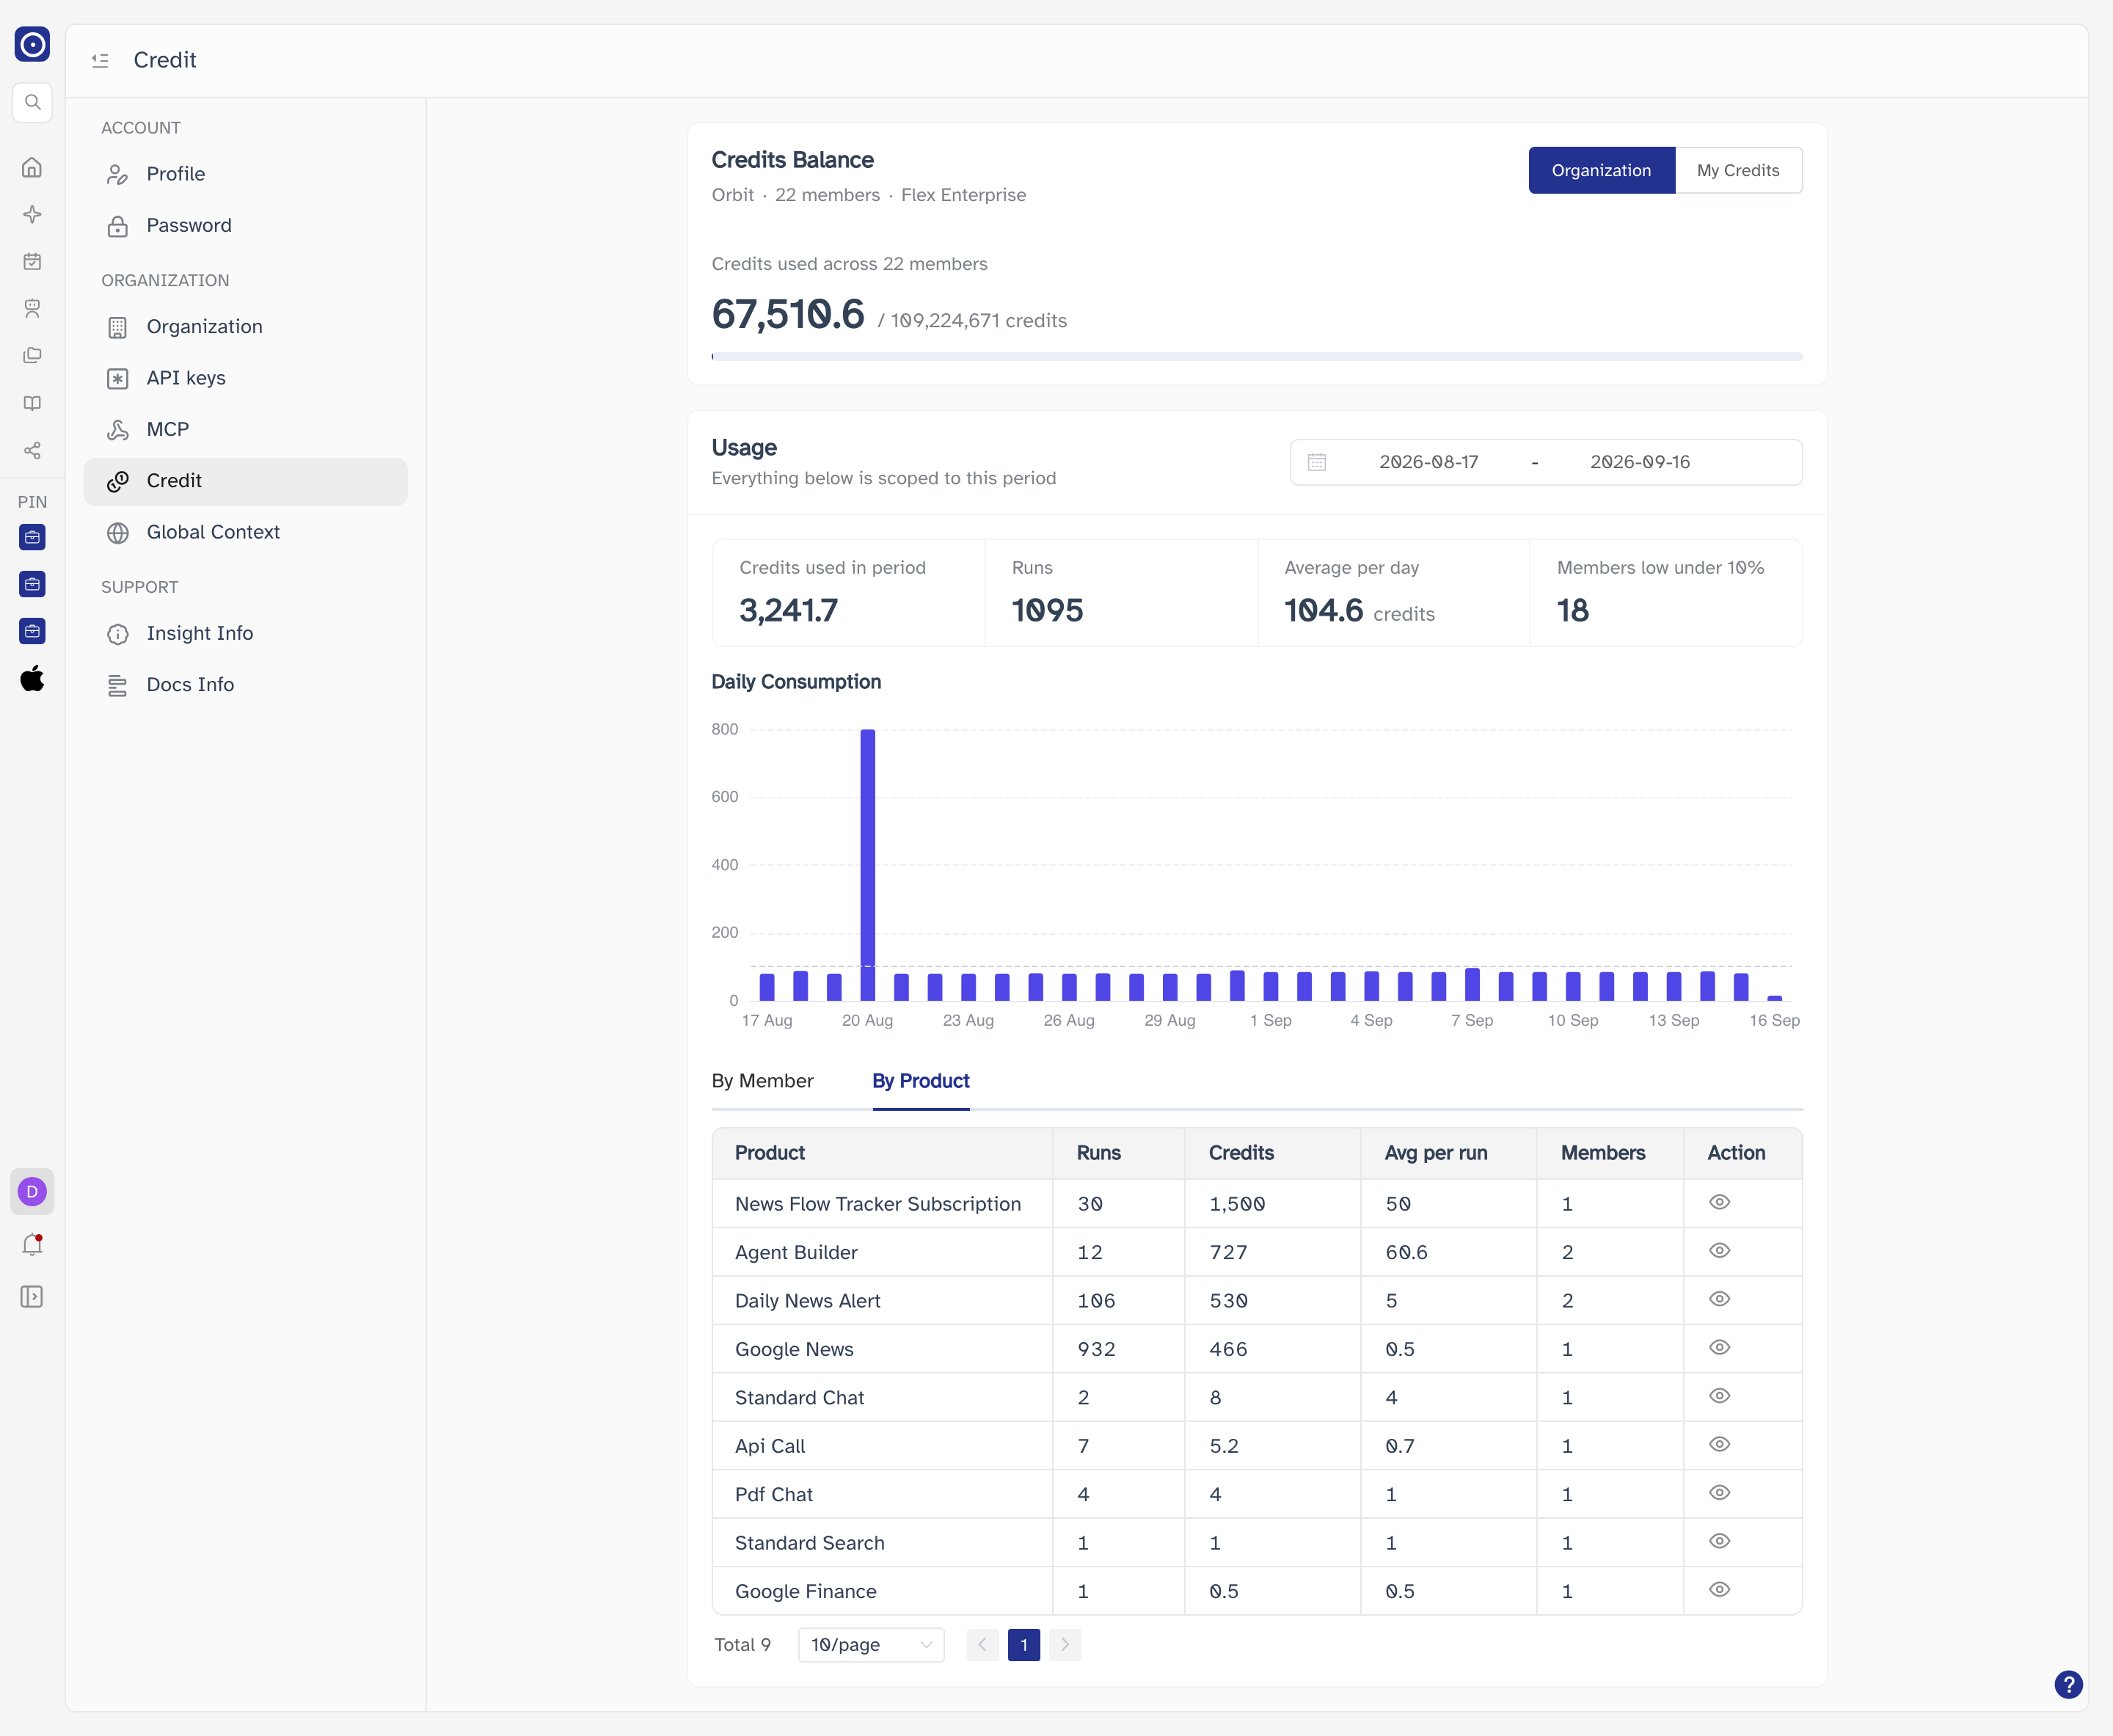
| Column | Meaning |
|---|---|
| Product | The Orbit feature that consumed the credits. |
| Runs | How many times it was run in the period. |
| Credits | Total credits it consumed. |
| Avg per run | Credits divided by runs — useful for spotting expensive features. |
| Members | How many different people used it. |
| Action | The eye icon opens the detail for that product. |
Both tables page 10 rows at a time, with the total count and page controls beneath them.
Usage detail
Click the eye icon on any row and a panel slides in from the right with every individual run behind that row's totals.
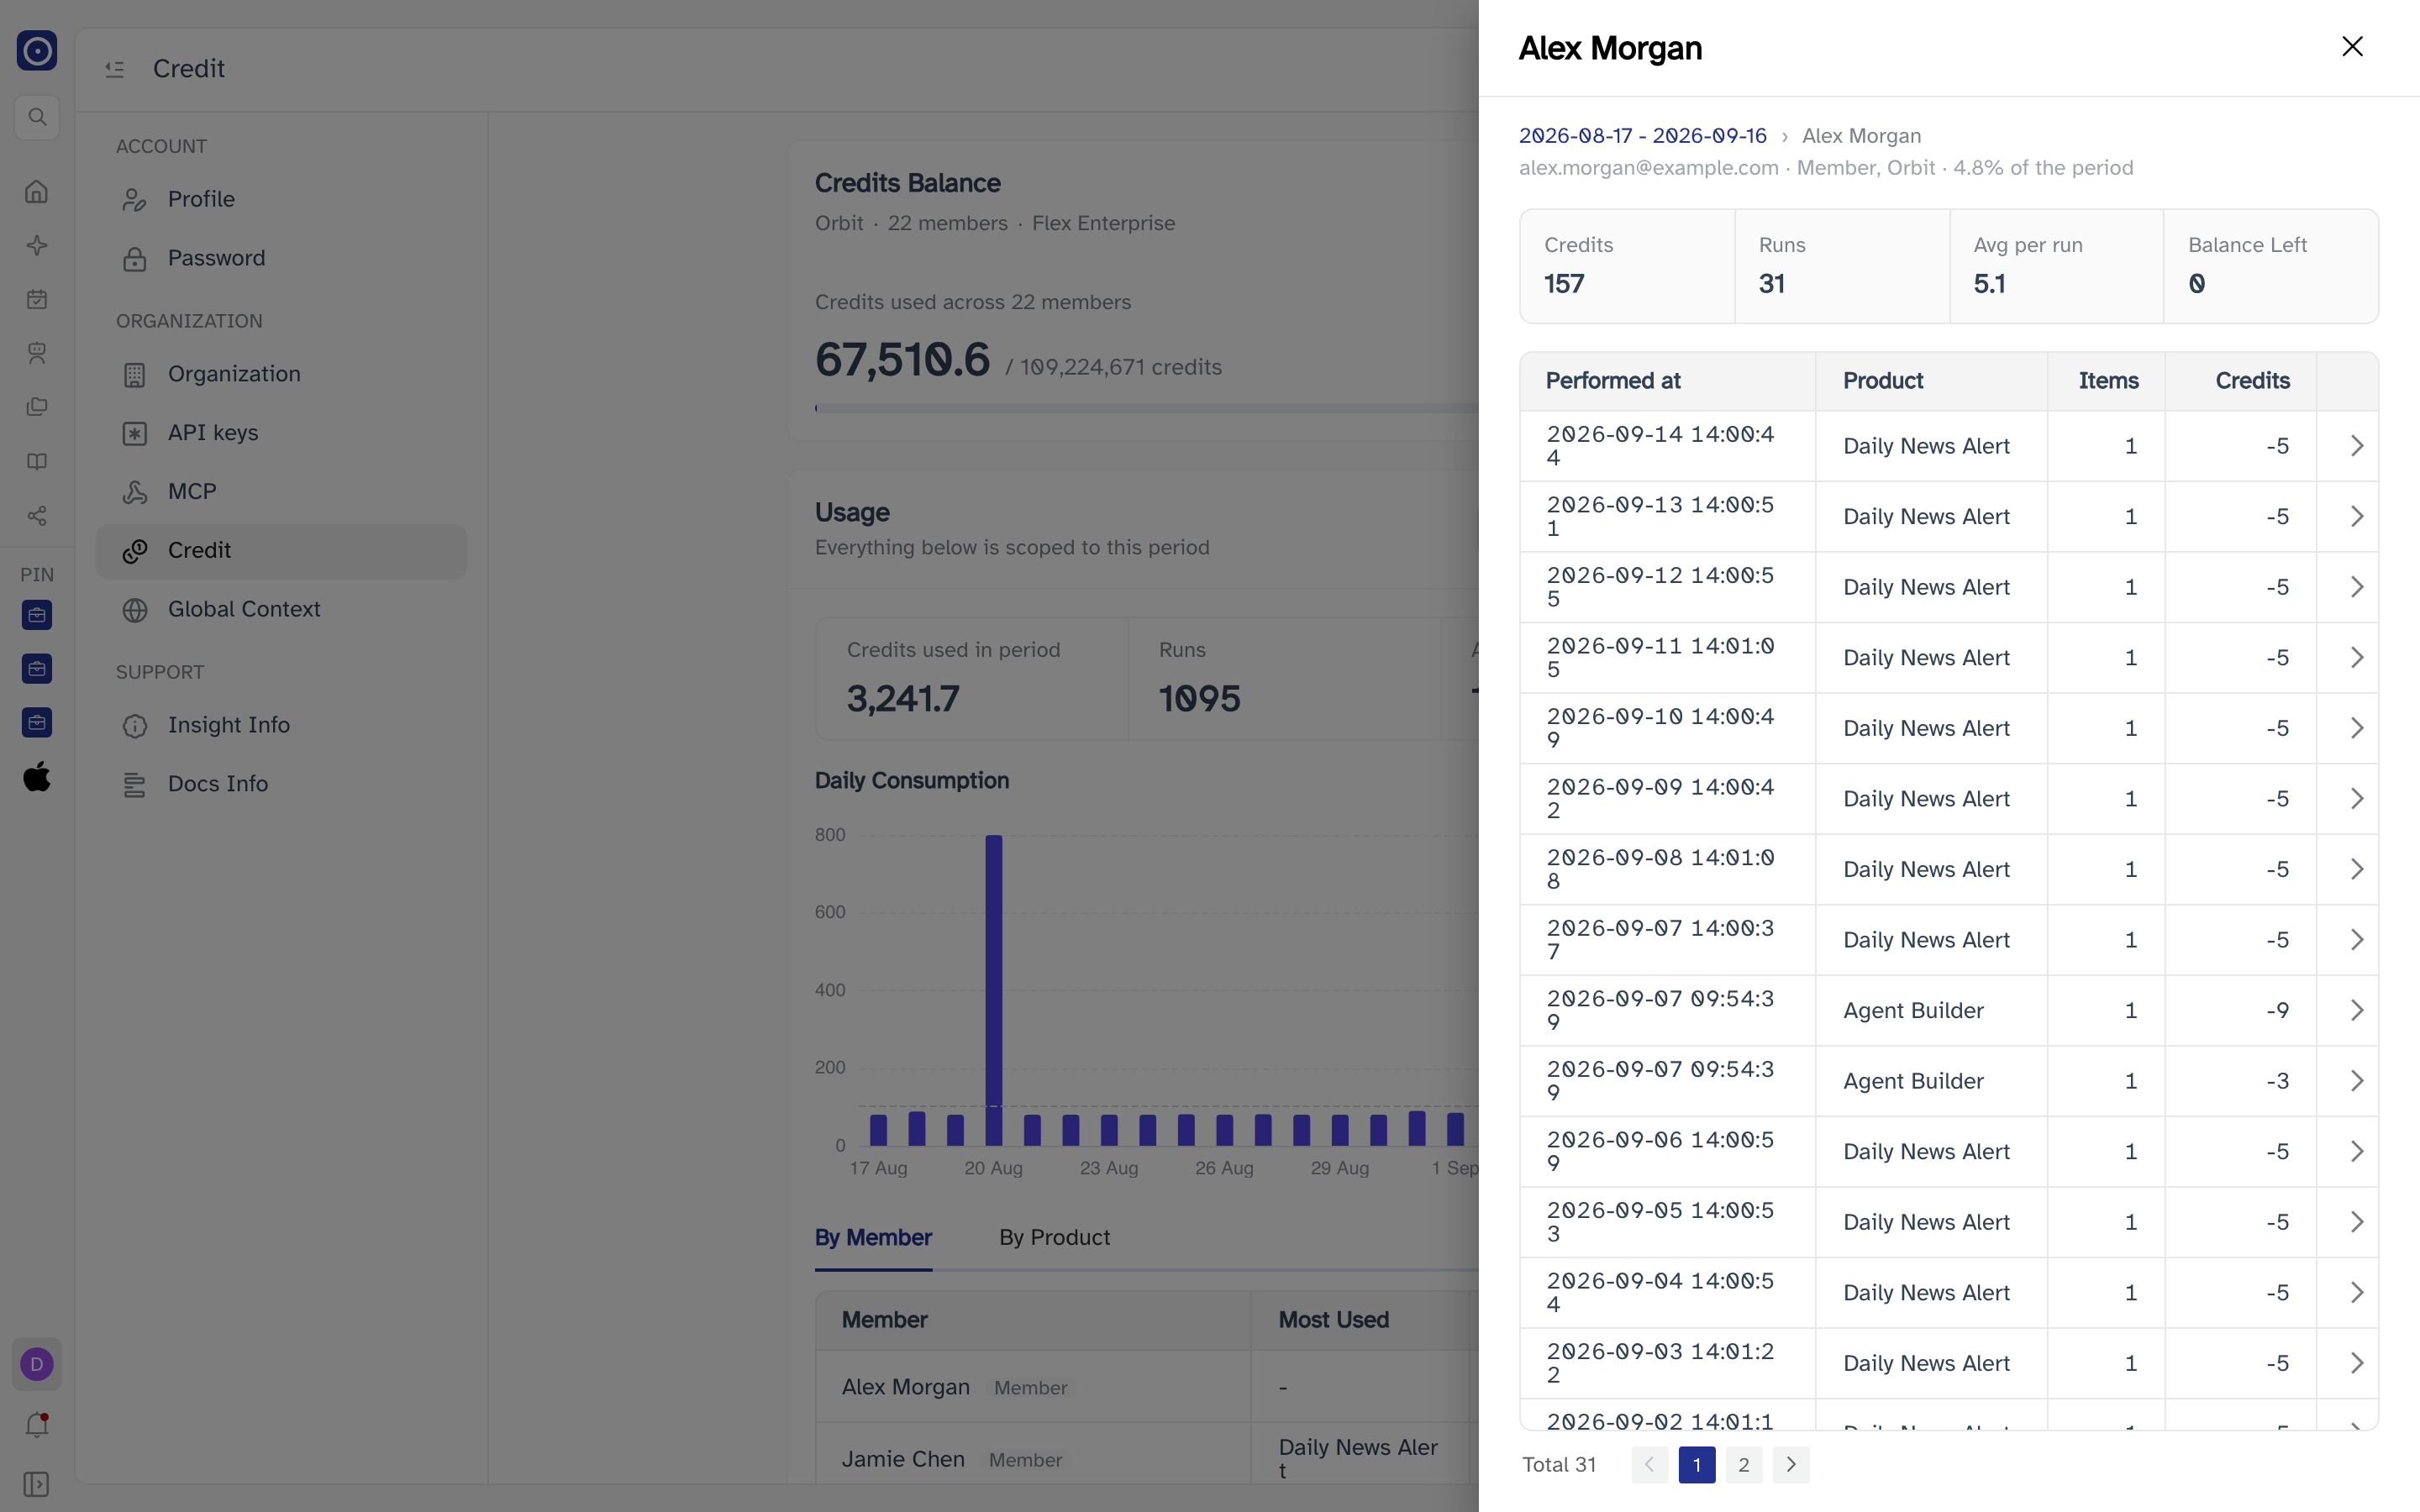
The four tiles at the top summarise the row:
- Credits — total consumed in the period.
- Runs — how many runs those credits paid for.
- Avg per run — the average cost of a run.
- Balance Left — credits still available.
Underneath, one row per run: when it happened, which product it used, how many items it covered, and the credits it cost. Expand a row with the arrow at its right for the individual items. The line above the tiles shows the date range and whose detail you are looking at.
Close the panel with the × in its top right to return to the table.