
News Flow Tracker
A system agent that reads the news for the companies and portfolios you care about, scores each company's coverage, and can keep doing it on a schedule. The page has three tabs: what the news looks like across the whole account, what you have subscribed to, and the individual records.
Opening the page
- In Agent Marketplace, open the left column's System Agents group and click General, then click the News Flow Tracker card.
- Or open the Dashboard and find the News Flow Tracker panel. Clicking its title opens this page.
- Or open News Research and click More in its Souce panel.
The Agent Marketplace card opens the page on Subscription. The Dashboard panel and News Research's More both open it on Detail.
The left rail has no News Flow Tracker item; the route is
/bots/news-flow-tracker. Typing the address with no parameters opens the page on
Subscription. Each row of the Detail tab has its own page — see
News flow detail.
The three tabs
Overview, Subscription and Detail are three views of the same agent, and the whole page is one screen high — the lists scroll inside their own panels rather than moving the page.
Switching tabs writes the choice into the address as news_tab —
dashboard, agentDashboard and table respectively. That is
why a link can land you on the one you did not expect, and why reloading keeps you where you
were. Re-opening a tab also re-runs its query, so the counters and lists refresh as you move
between them.
Overview
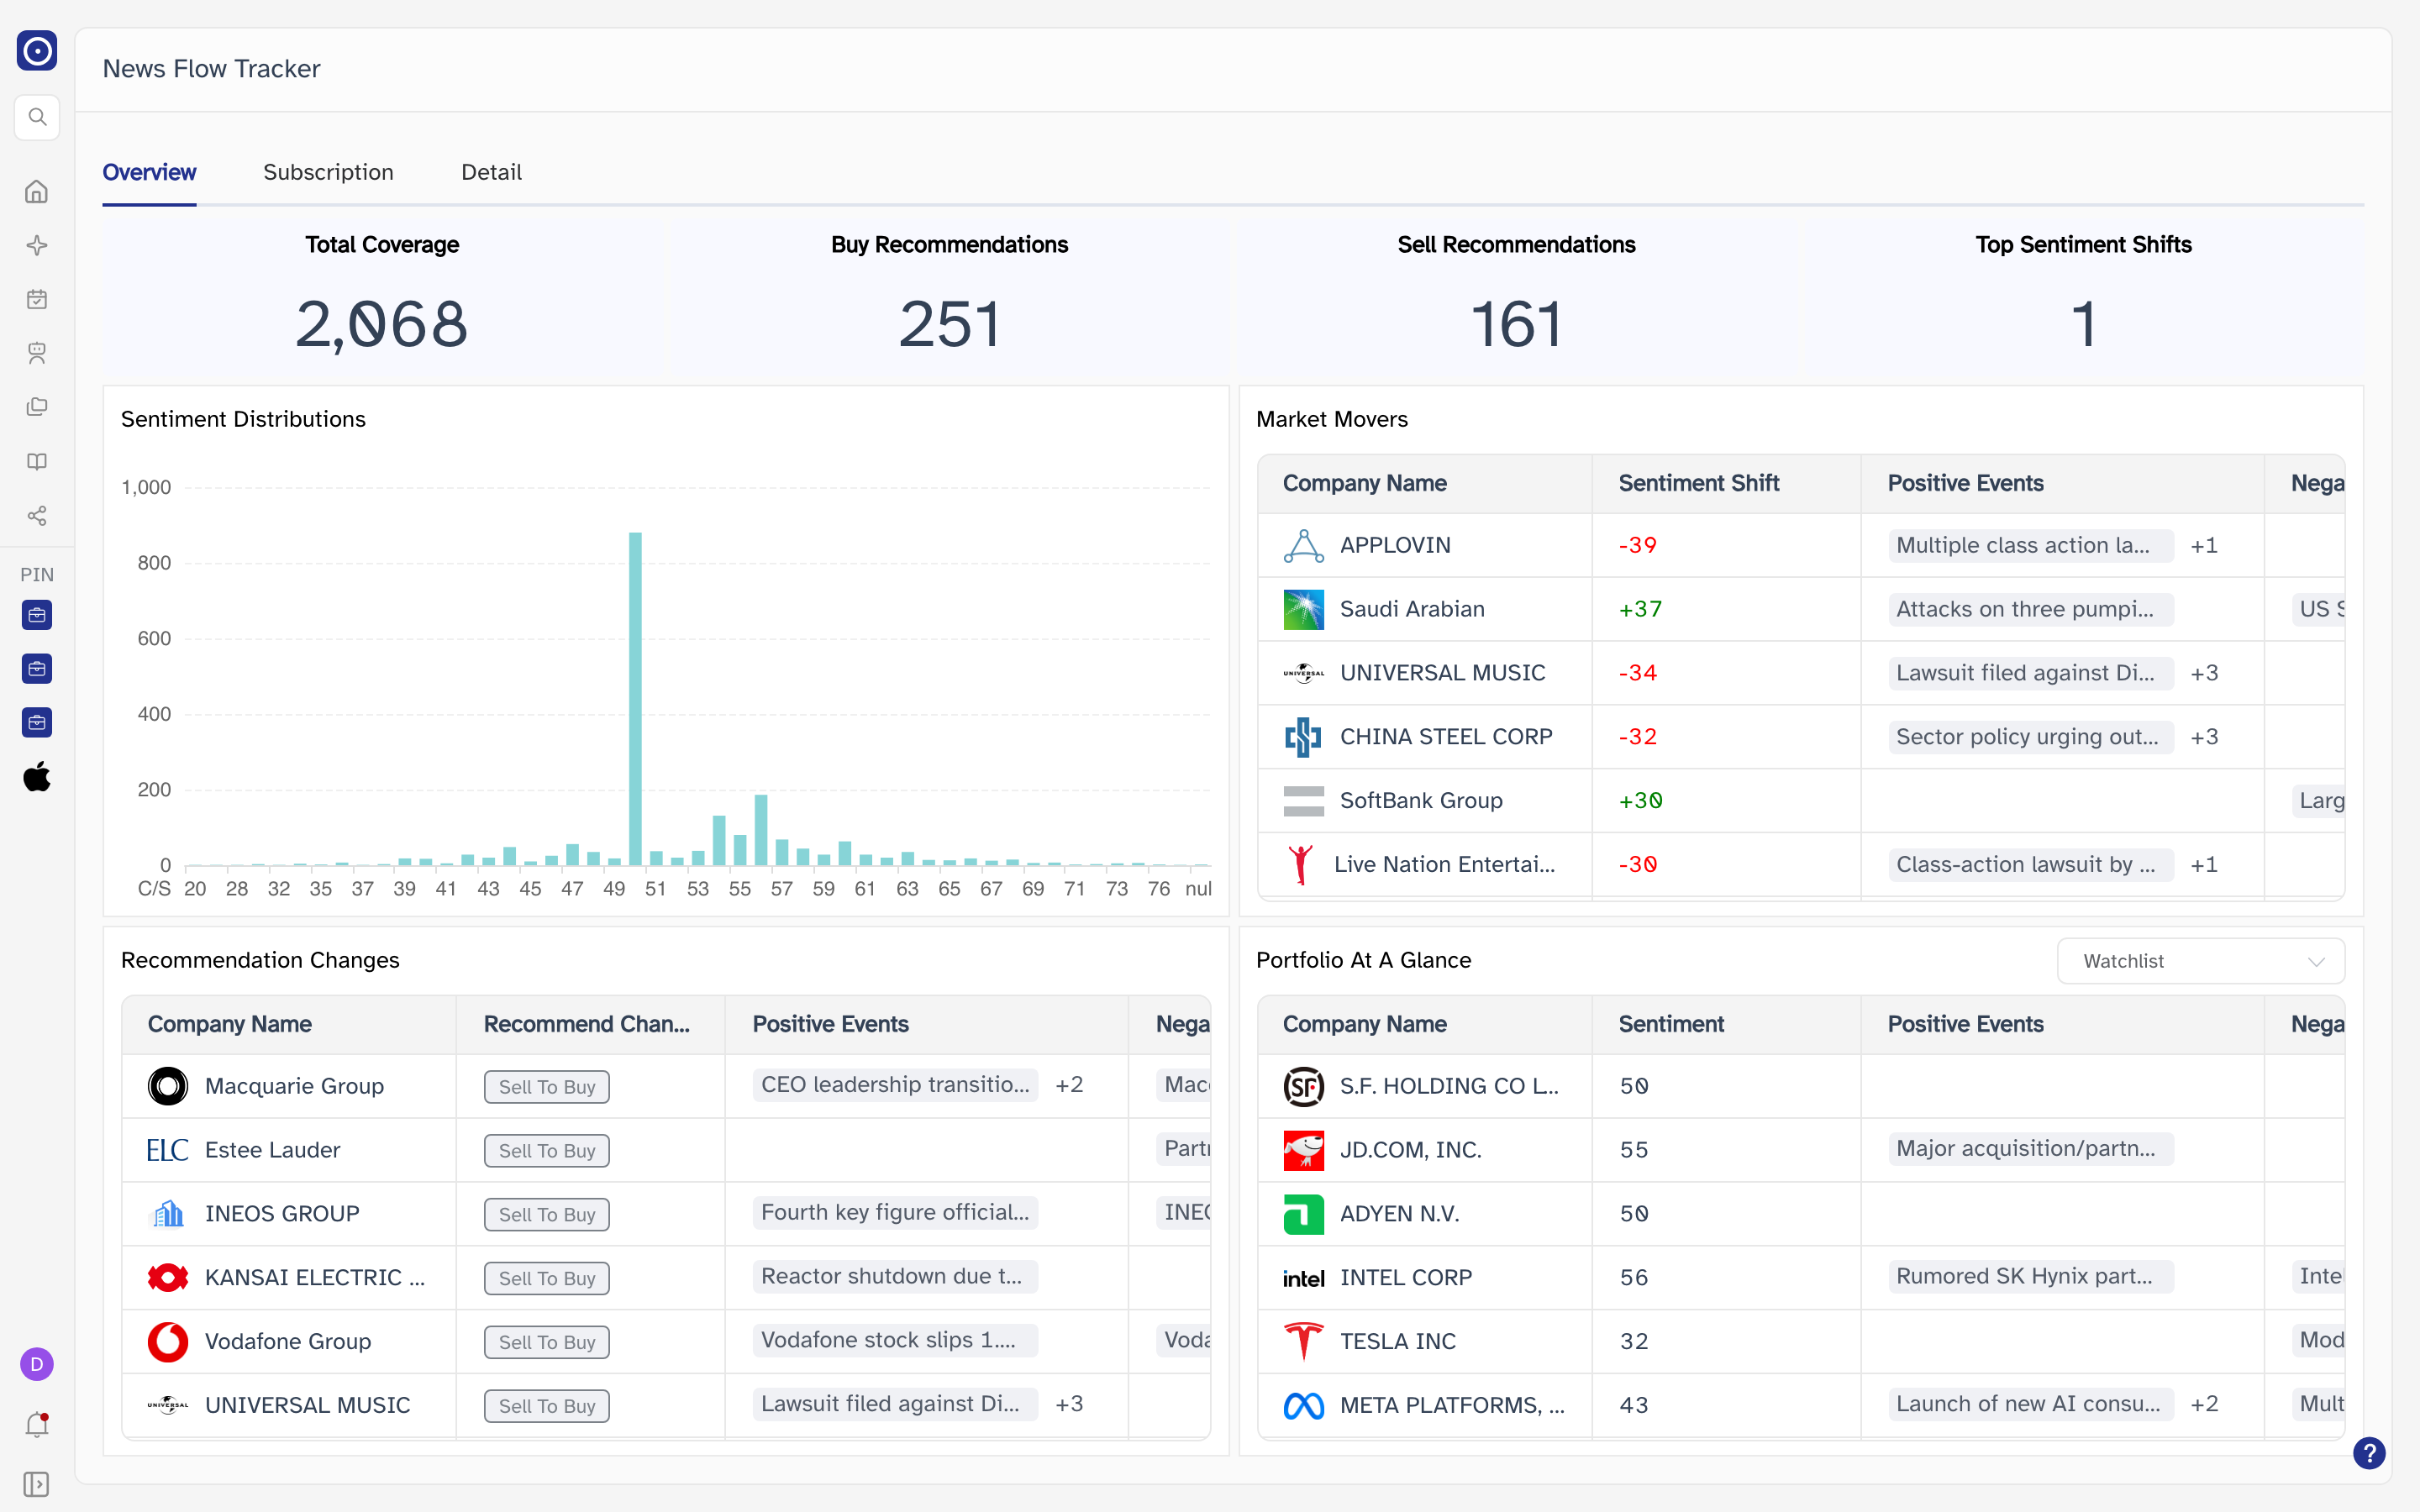
The first tab is the widest view of the three: it describes the news Orbit has read for the whole account, not just for what you subscribed to below. Its four counts and four panels are all built from the same body of coverage, and none of them reacts to the Subscription tab's filters.
The four counts
Four numbers across the top, each counting companies rather than articles, over the window the agent is working with.
| Count | What it counts |
|---|---|
| Total Coverage | Every company the agent has a record of. |
| Buy Recommendations | Those whose latest record recommends buying. |
| Sell Recommendations | Those whose latest record recommends selling. |
| Top Sentiment Shifts | Those whose score moved most, counted as the sharp rises plus the sharp falls. |
Every number on this tab animates up from zero over about three seconds when the tab is opened or re-opened, so read them a moment after the page settles rather than mid-count.

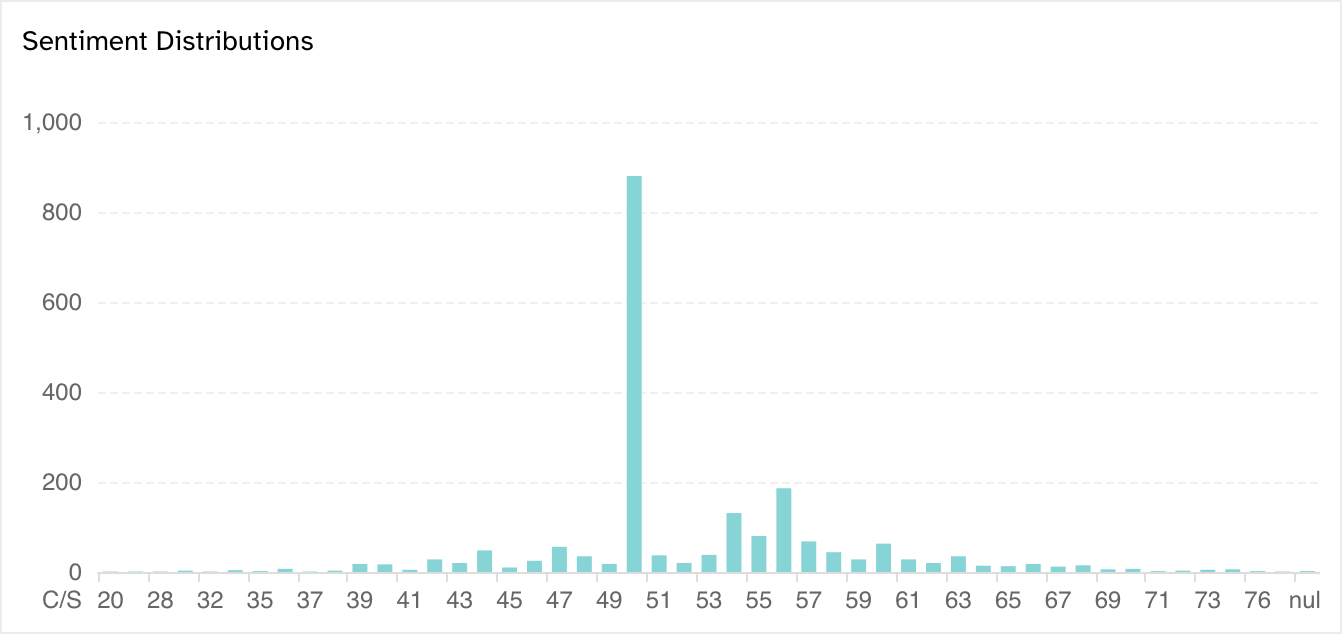
Sentiment Distributions
A bar chart of the whole coverage: one bar per sentiment score, its height the number of companies sitting on that score. It answers "where is the market's mood concentrated" without naming a single company.
The horizontal axis runs from C/S — companies the agent has a record for but no score — through the scores themselves, and ends at null. One tall bar is normal: the score of 50 is the baseline the agent falls back on when a company's coverage contains no qualifying event.
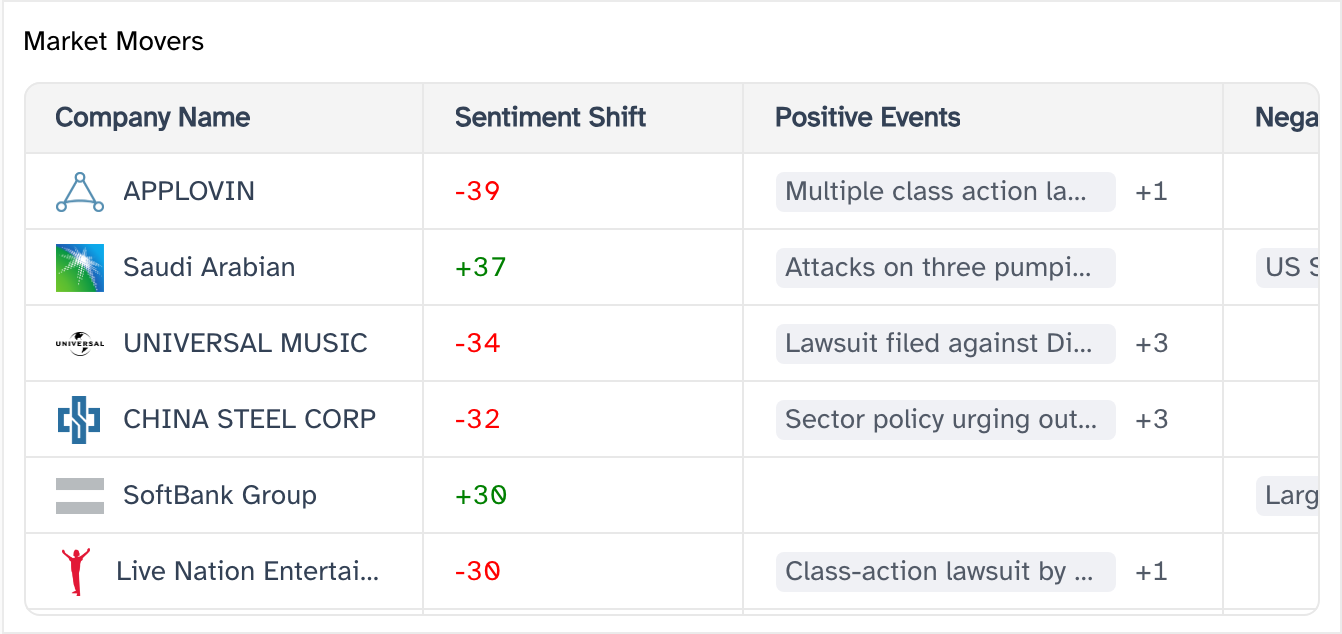
Market Movers
The companies whose news sentiment moved the most, largest move first.
| Column | What it holds |
|---|---|
| Company Name | The company, with its logo. Clicking the name opens the company's page. |
| Sentiment Shift | How far the score moved, signed and coloured — green for a rise, red for a fall. |
| Positive Events | The events behind the move. The cell shows the first one and defers the rest to a hover. |
| Negative Events | The same, for the negative side. |
| Last 7 Days | A small line chart of that company's score over the past week, green when the week ended higher than it started and red when it ended lower. |
Recommendation Changes
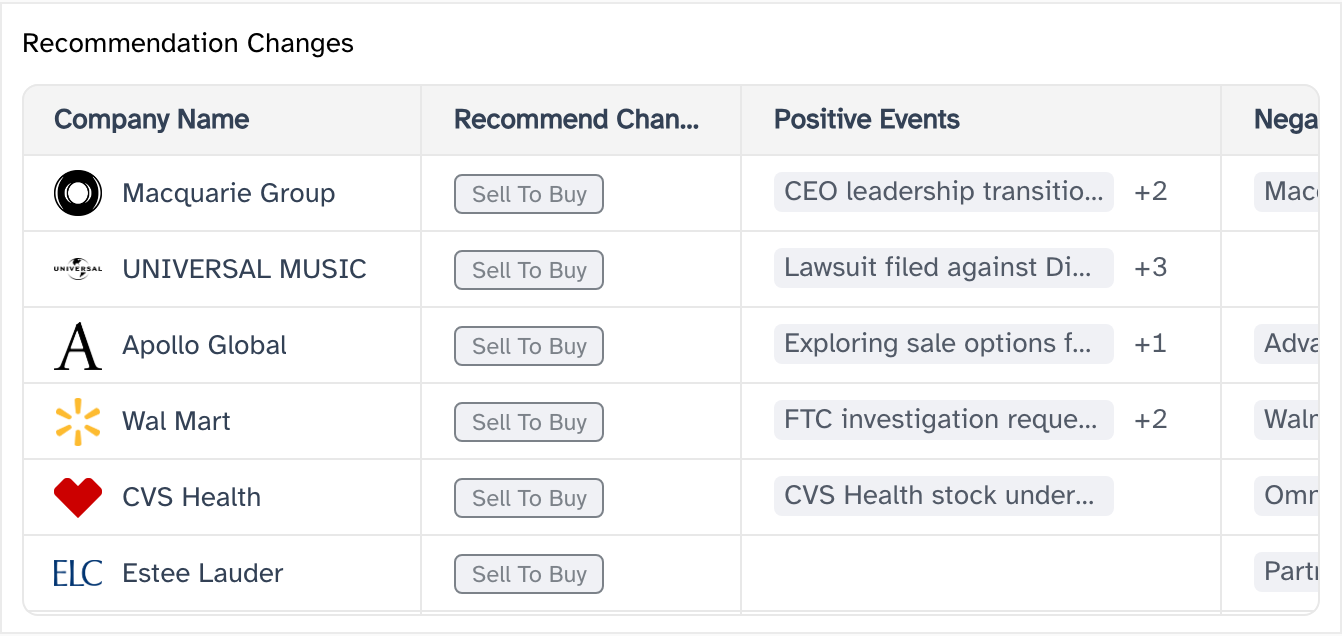
Companies whose recommendation flipped — the smaller, sharper list. Its columns are Market Movers' with one substitution: Recommend Change in place of Sentiment Shift, carrying either Buy To Sell or Sell To Buy.
Portfolio At A Glance
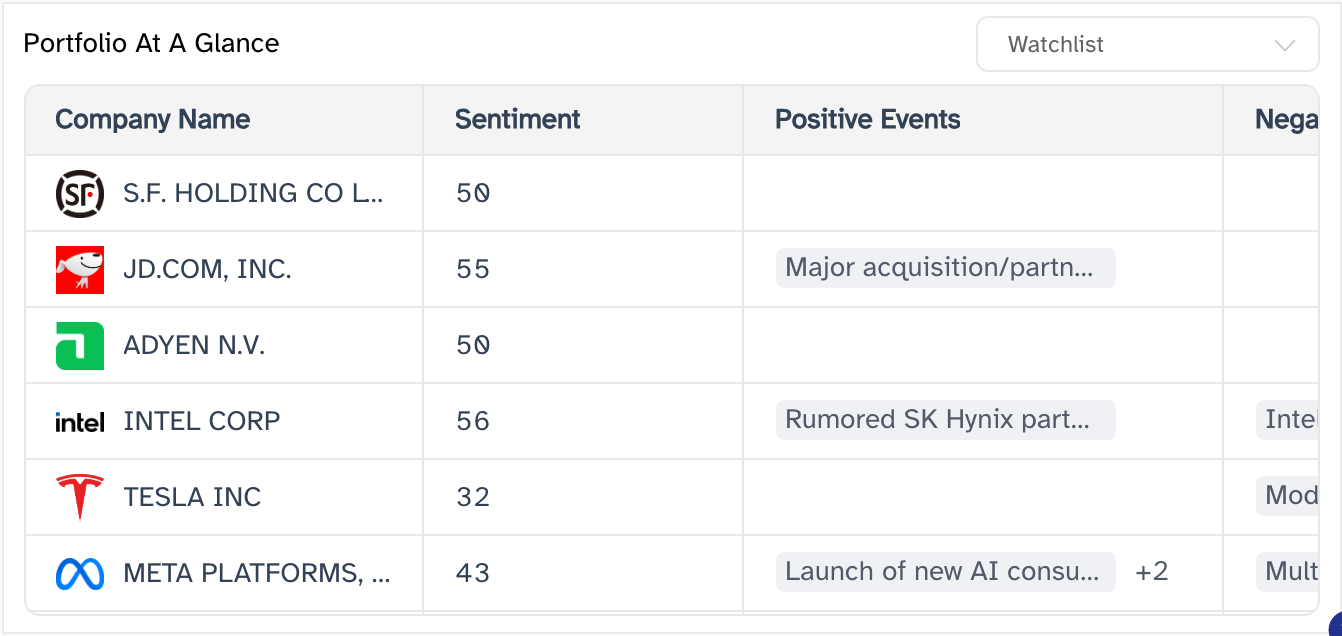
The same style of table, restricted to one portfolio. A dropdown beside the panel title chooses which; it opens on the first entry of your portfolio list, which on most accounts is the built-in Watchlist.
This table's score column is the plain Sentiment score rather than a shift, so the panel reads as a standing snapshot of the portfolio rather than a change log.
Subscription
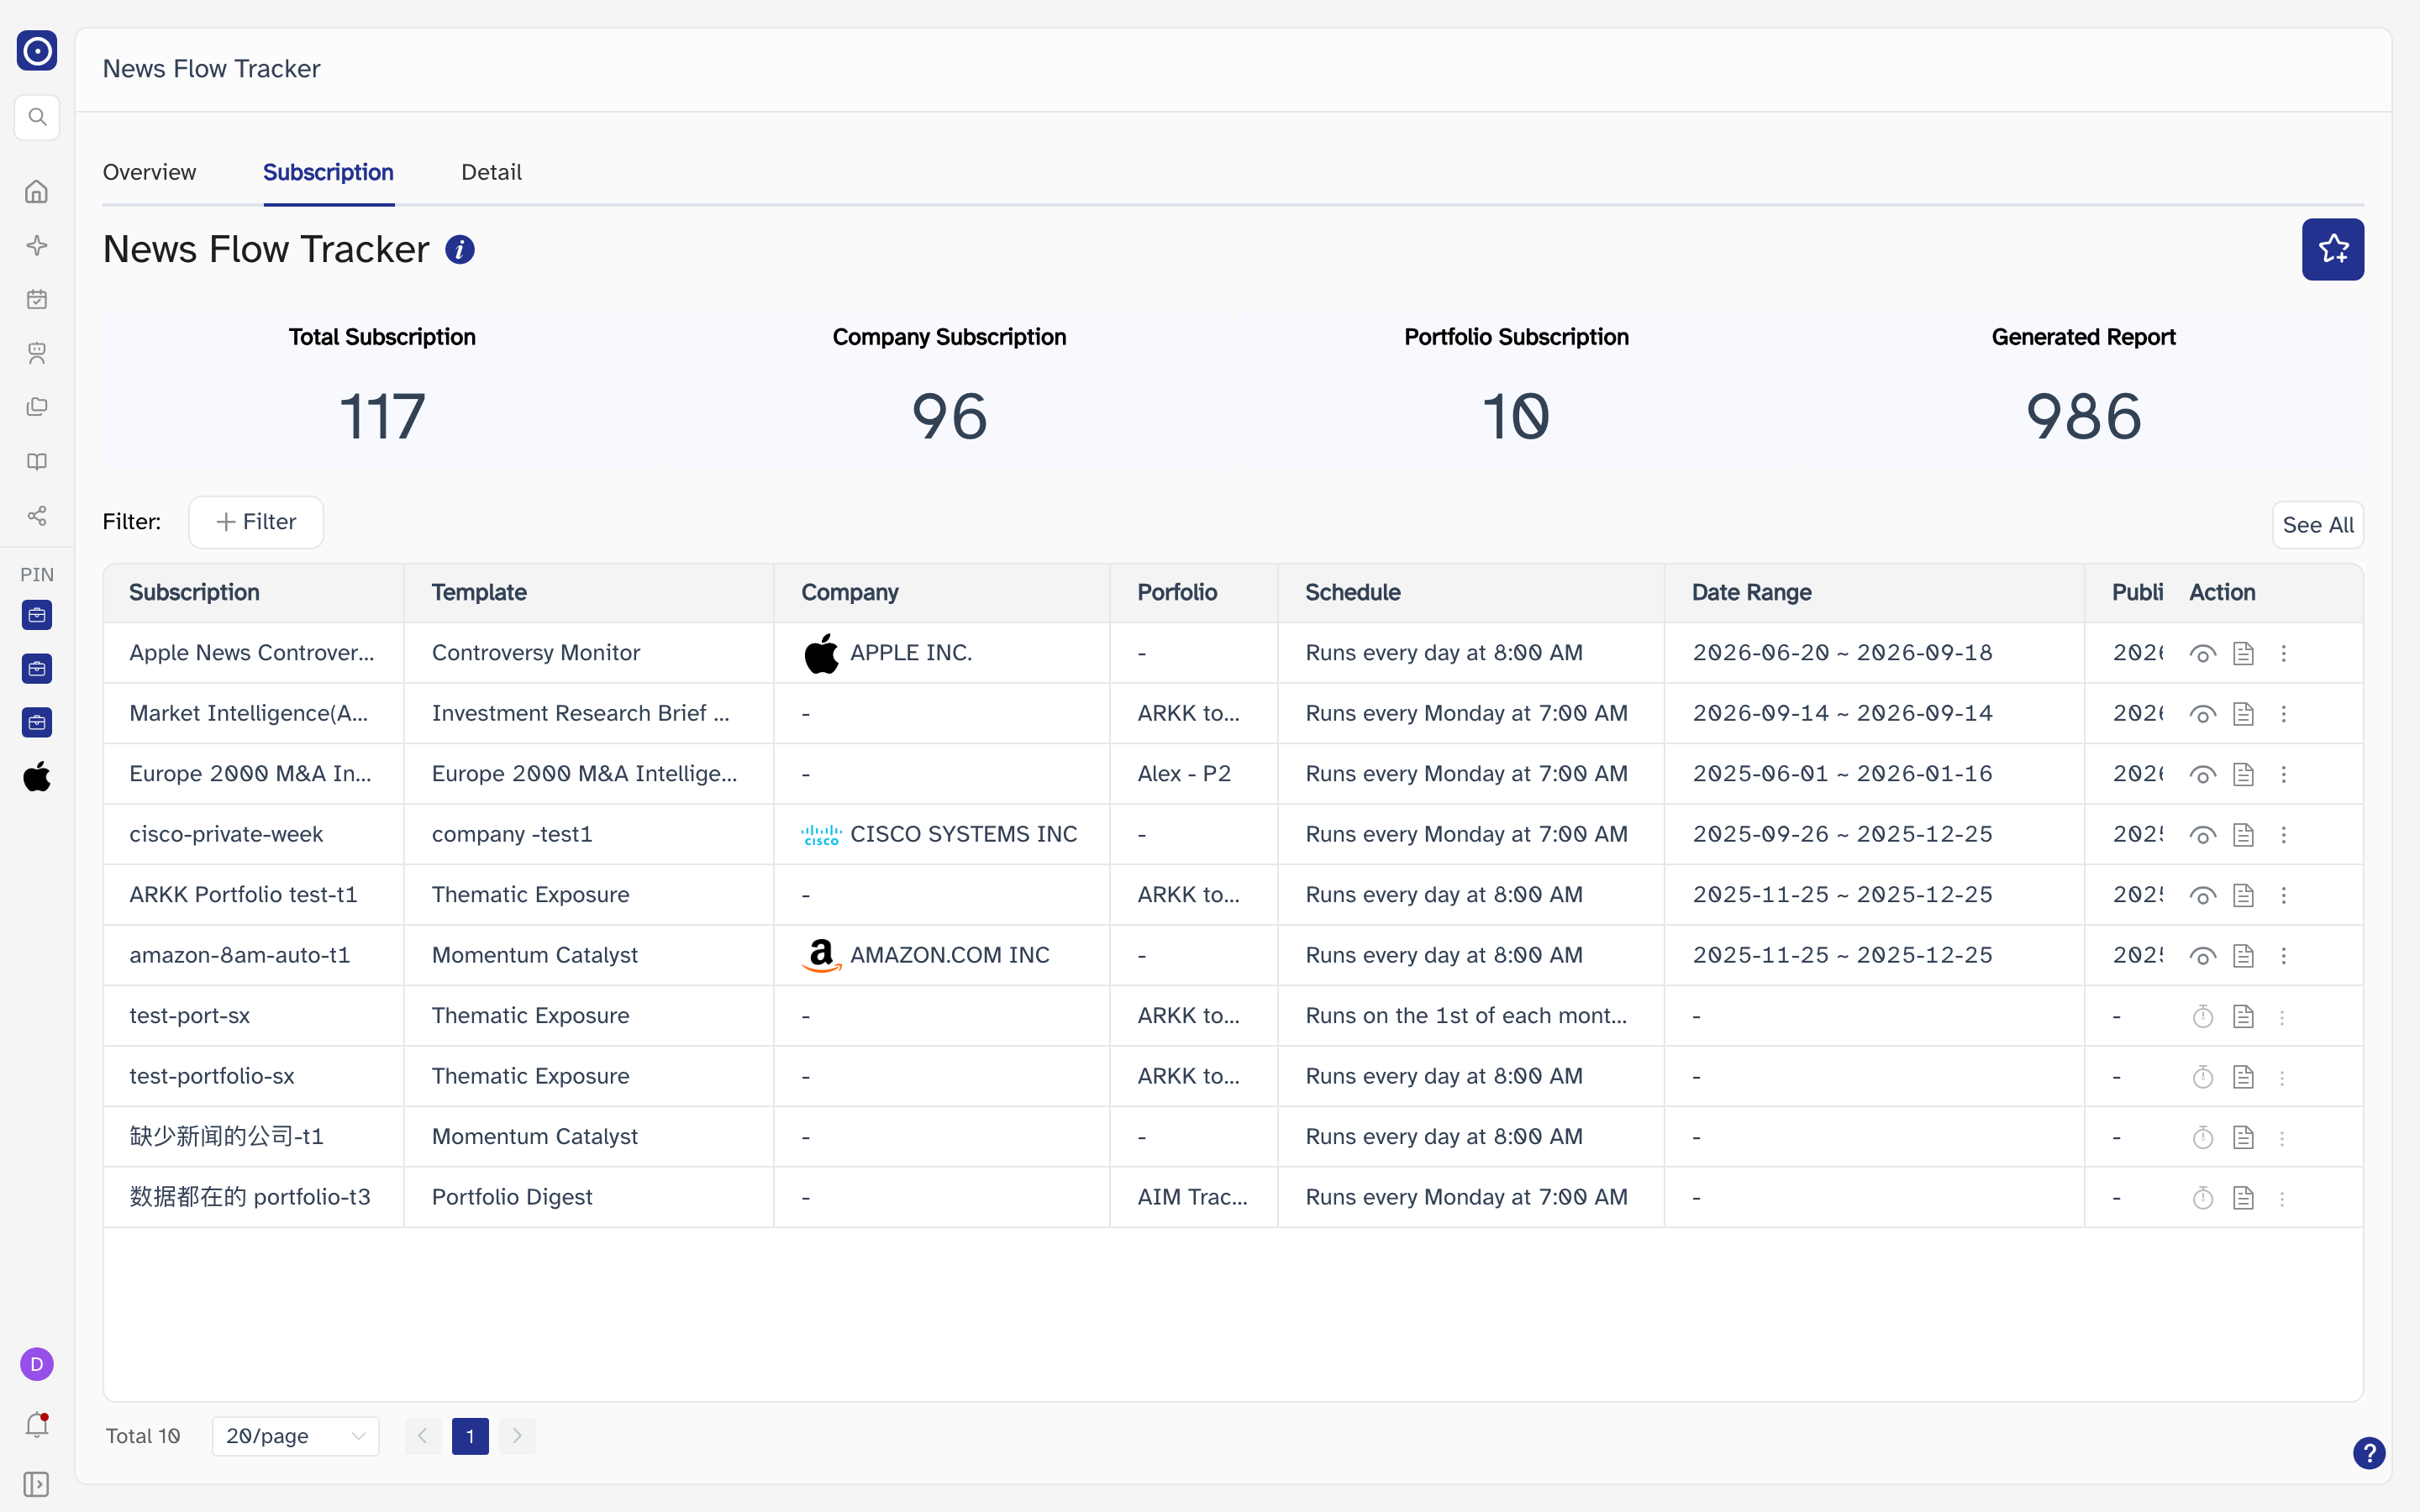
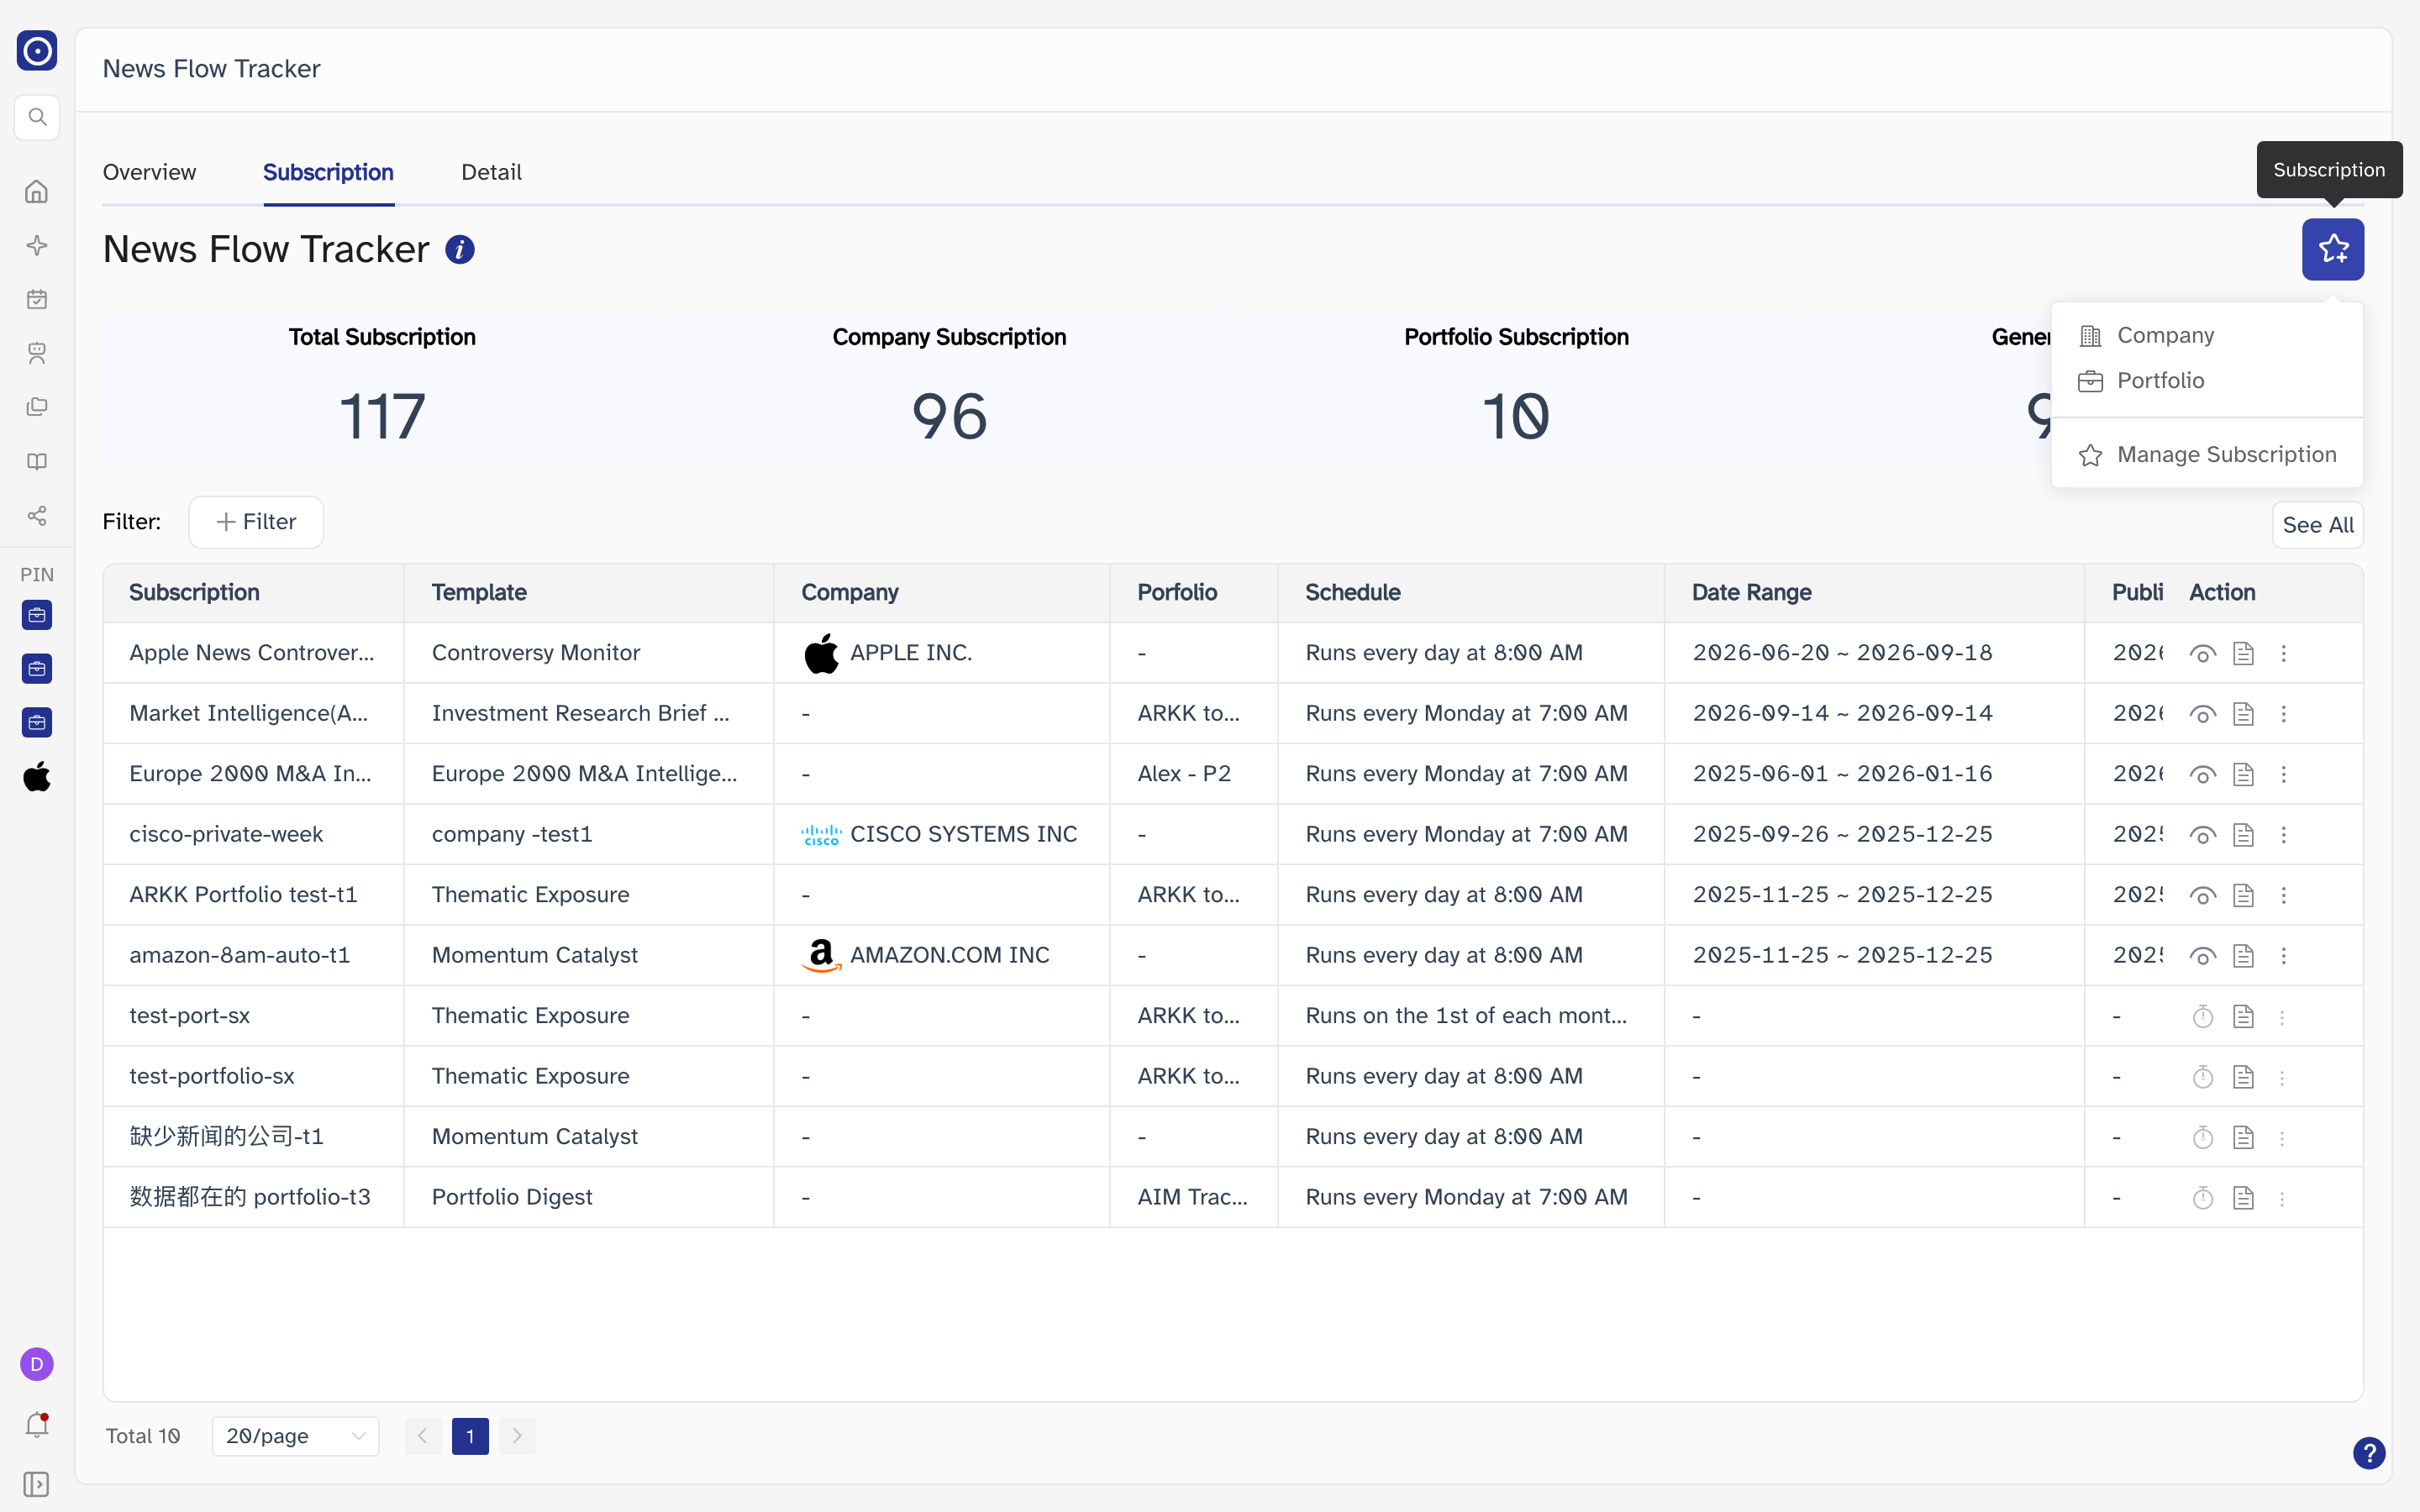
The tab the Agent Marketplace card lands on, and the one that turns the agent into something that runs for you. It lists what this agent has been pointed at, and each row is the latest result of one of those subscriptions.
The header
The page title carries an information icon, and the button at the right is Subscription.
| Element | What it does |
|---|---|
| Information icon | Opens an overlay describing the agent — see Discover It below. Its tooltip reads Discover It ! |
| Subscription | A dropdown with three entries: Company, Portfolio and Manage Subscription. The first two open the subscription form; the third leaves for Schedules. |
The four counts
Four more numbers across the top, and they count the whole account rather than this agent: how many subscriptions exist in total, how many of them watch a company, how many watch a portfolio, and how many reports those subscriptions have generated between them.
The counts cover every subscription on the account, while the table underneath covers only the ones belonging to News Flow Tracker. A large Total Subscription above a short list is expected, not a loading problem.

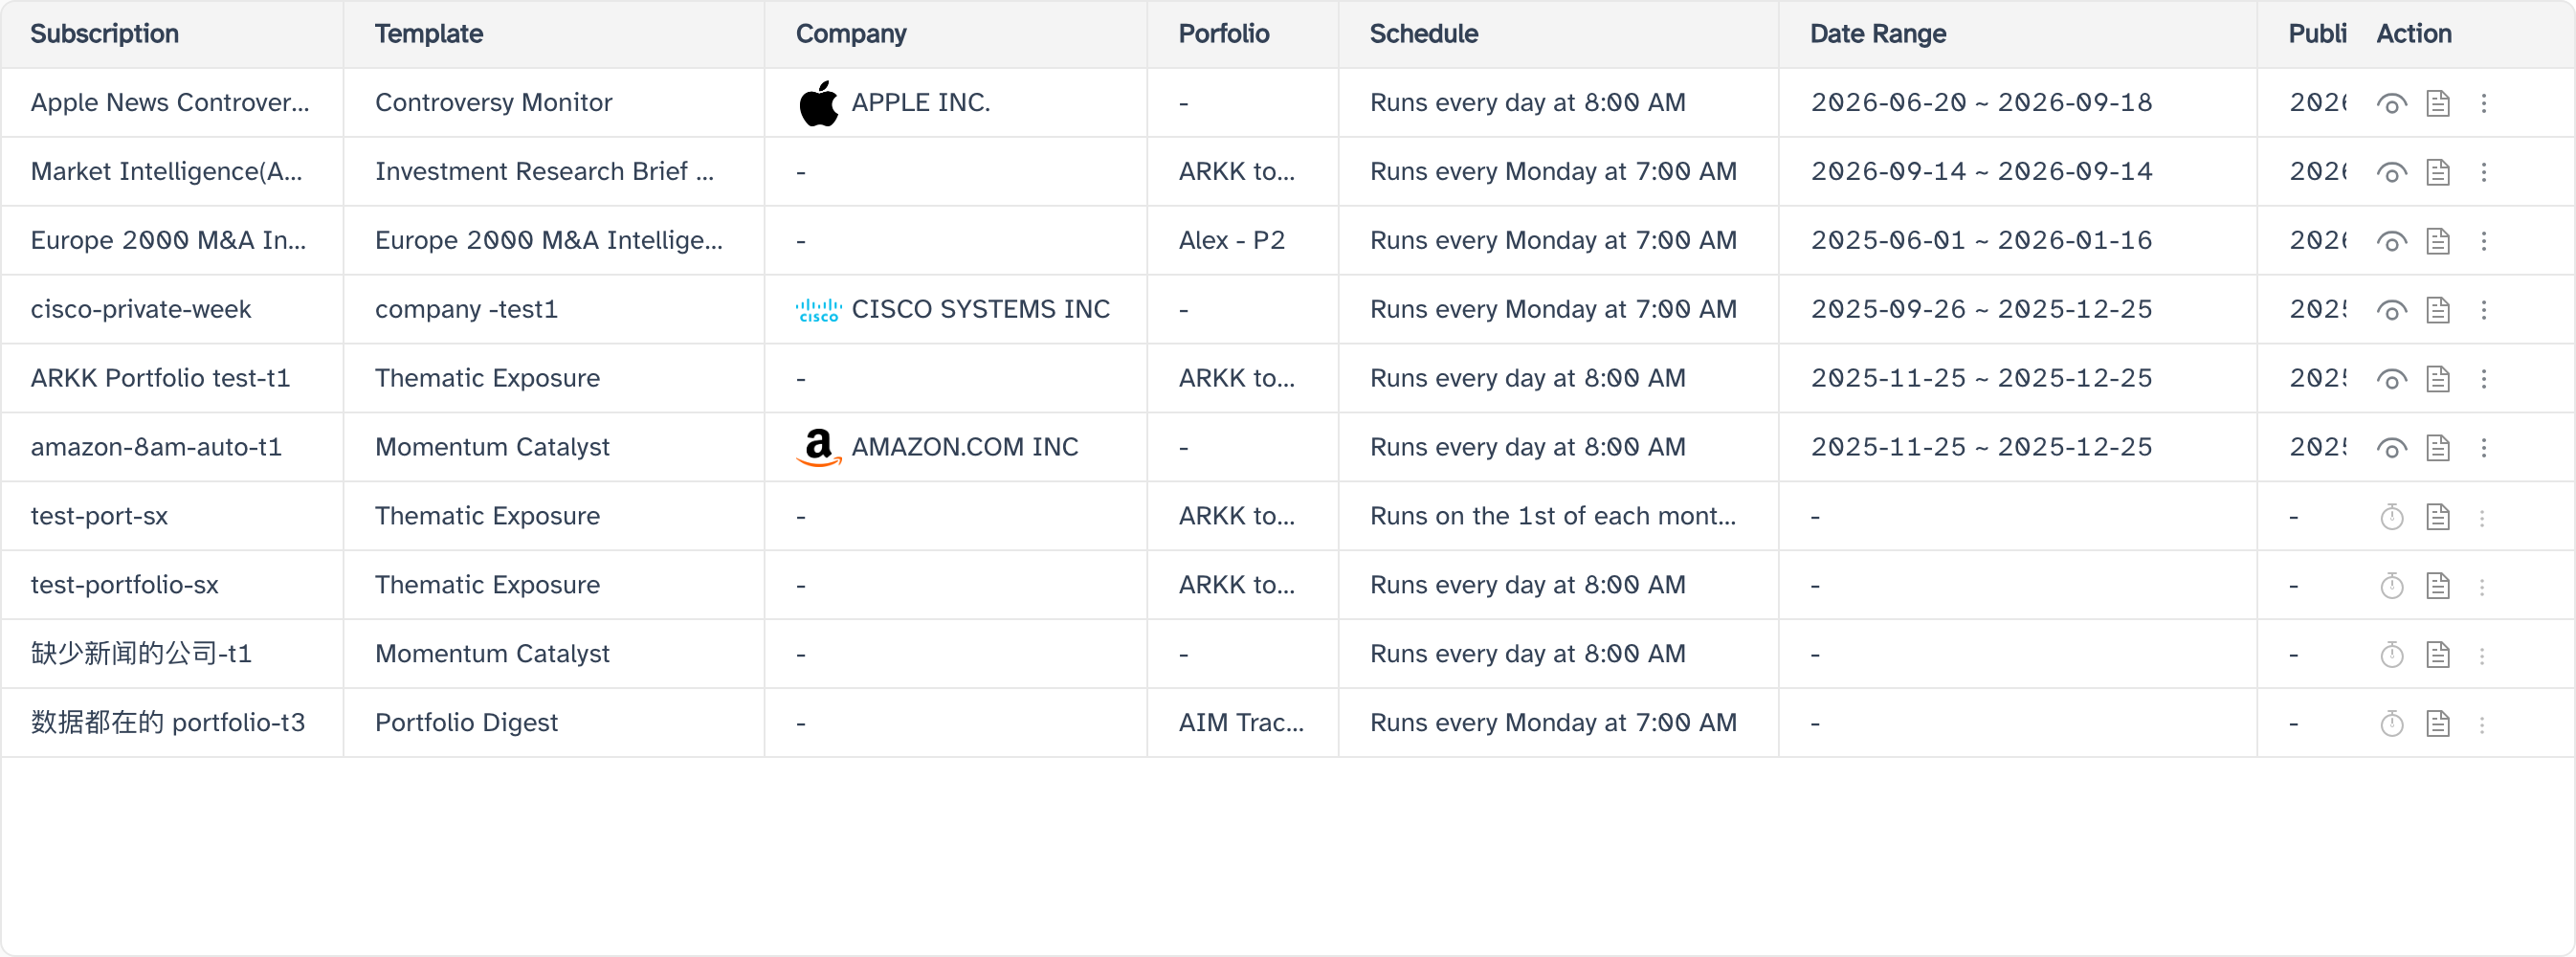
The list
One row per subscription, newest result first.
| Column | What it holds |
|---|---|
| Subscription | The name given to that subscription when it was created. |
| Template | The prompt template it runs with. |
| Company | The company it watches, or a dash when it watches a portfolio instead. Clicking the name opens the company's page. |
| Porfolio | The portfolio it watches, or a dash. The heading is spelt this way on the page. |
| Schedule | How often it runs and at what time, in a sentence. |
| Date Range | The stretch of news the latest result covers. |
| Publish Date | When that result was written. |
| Action | Three icons — see The Action column below. |
The list paginates at 20 rows, and the page-size control offers 20, 50 and 100.
Filtering the list
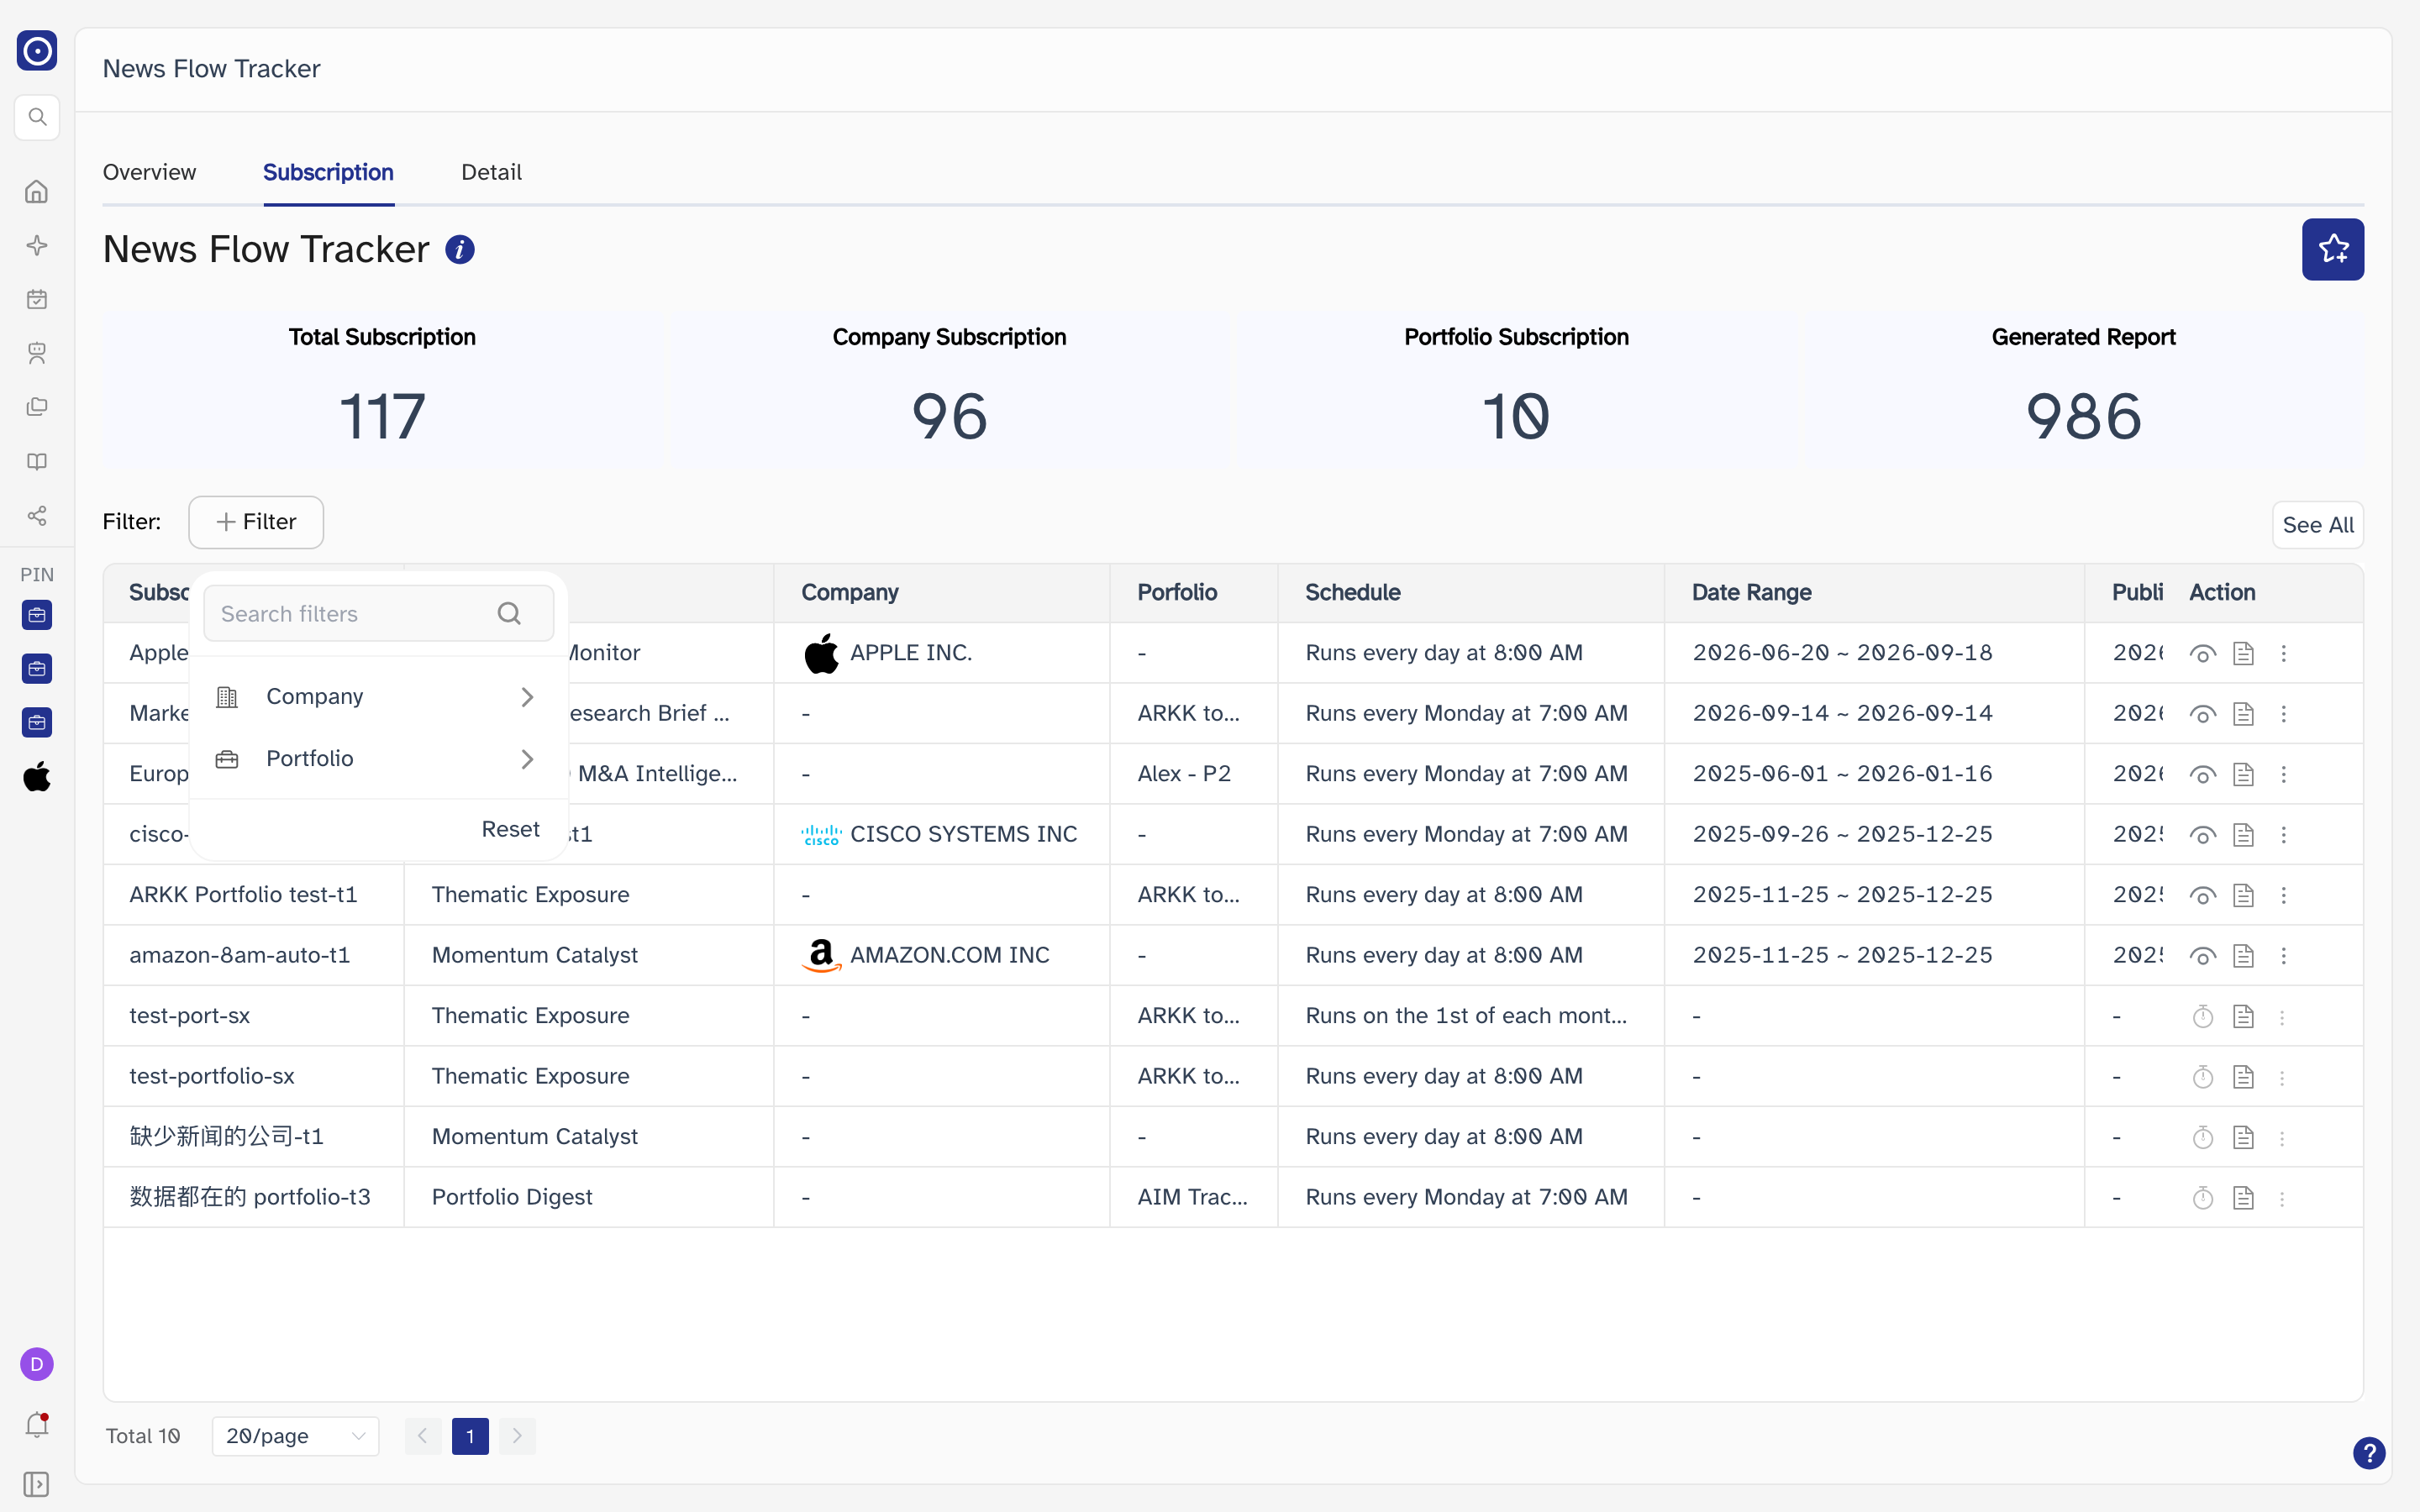
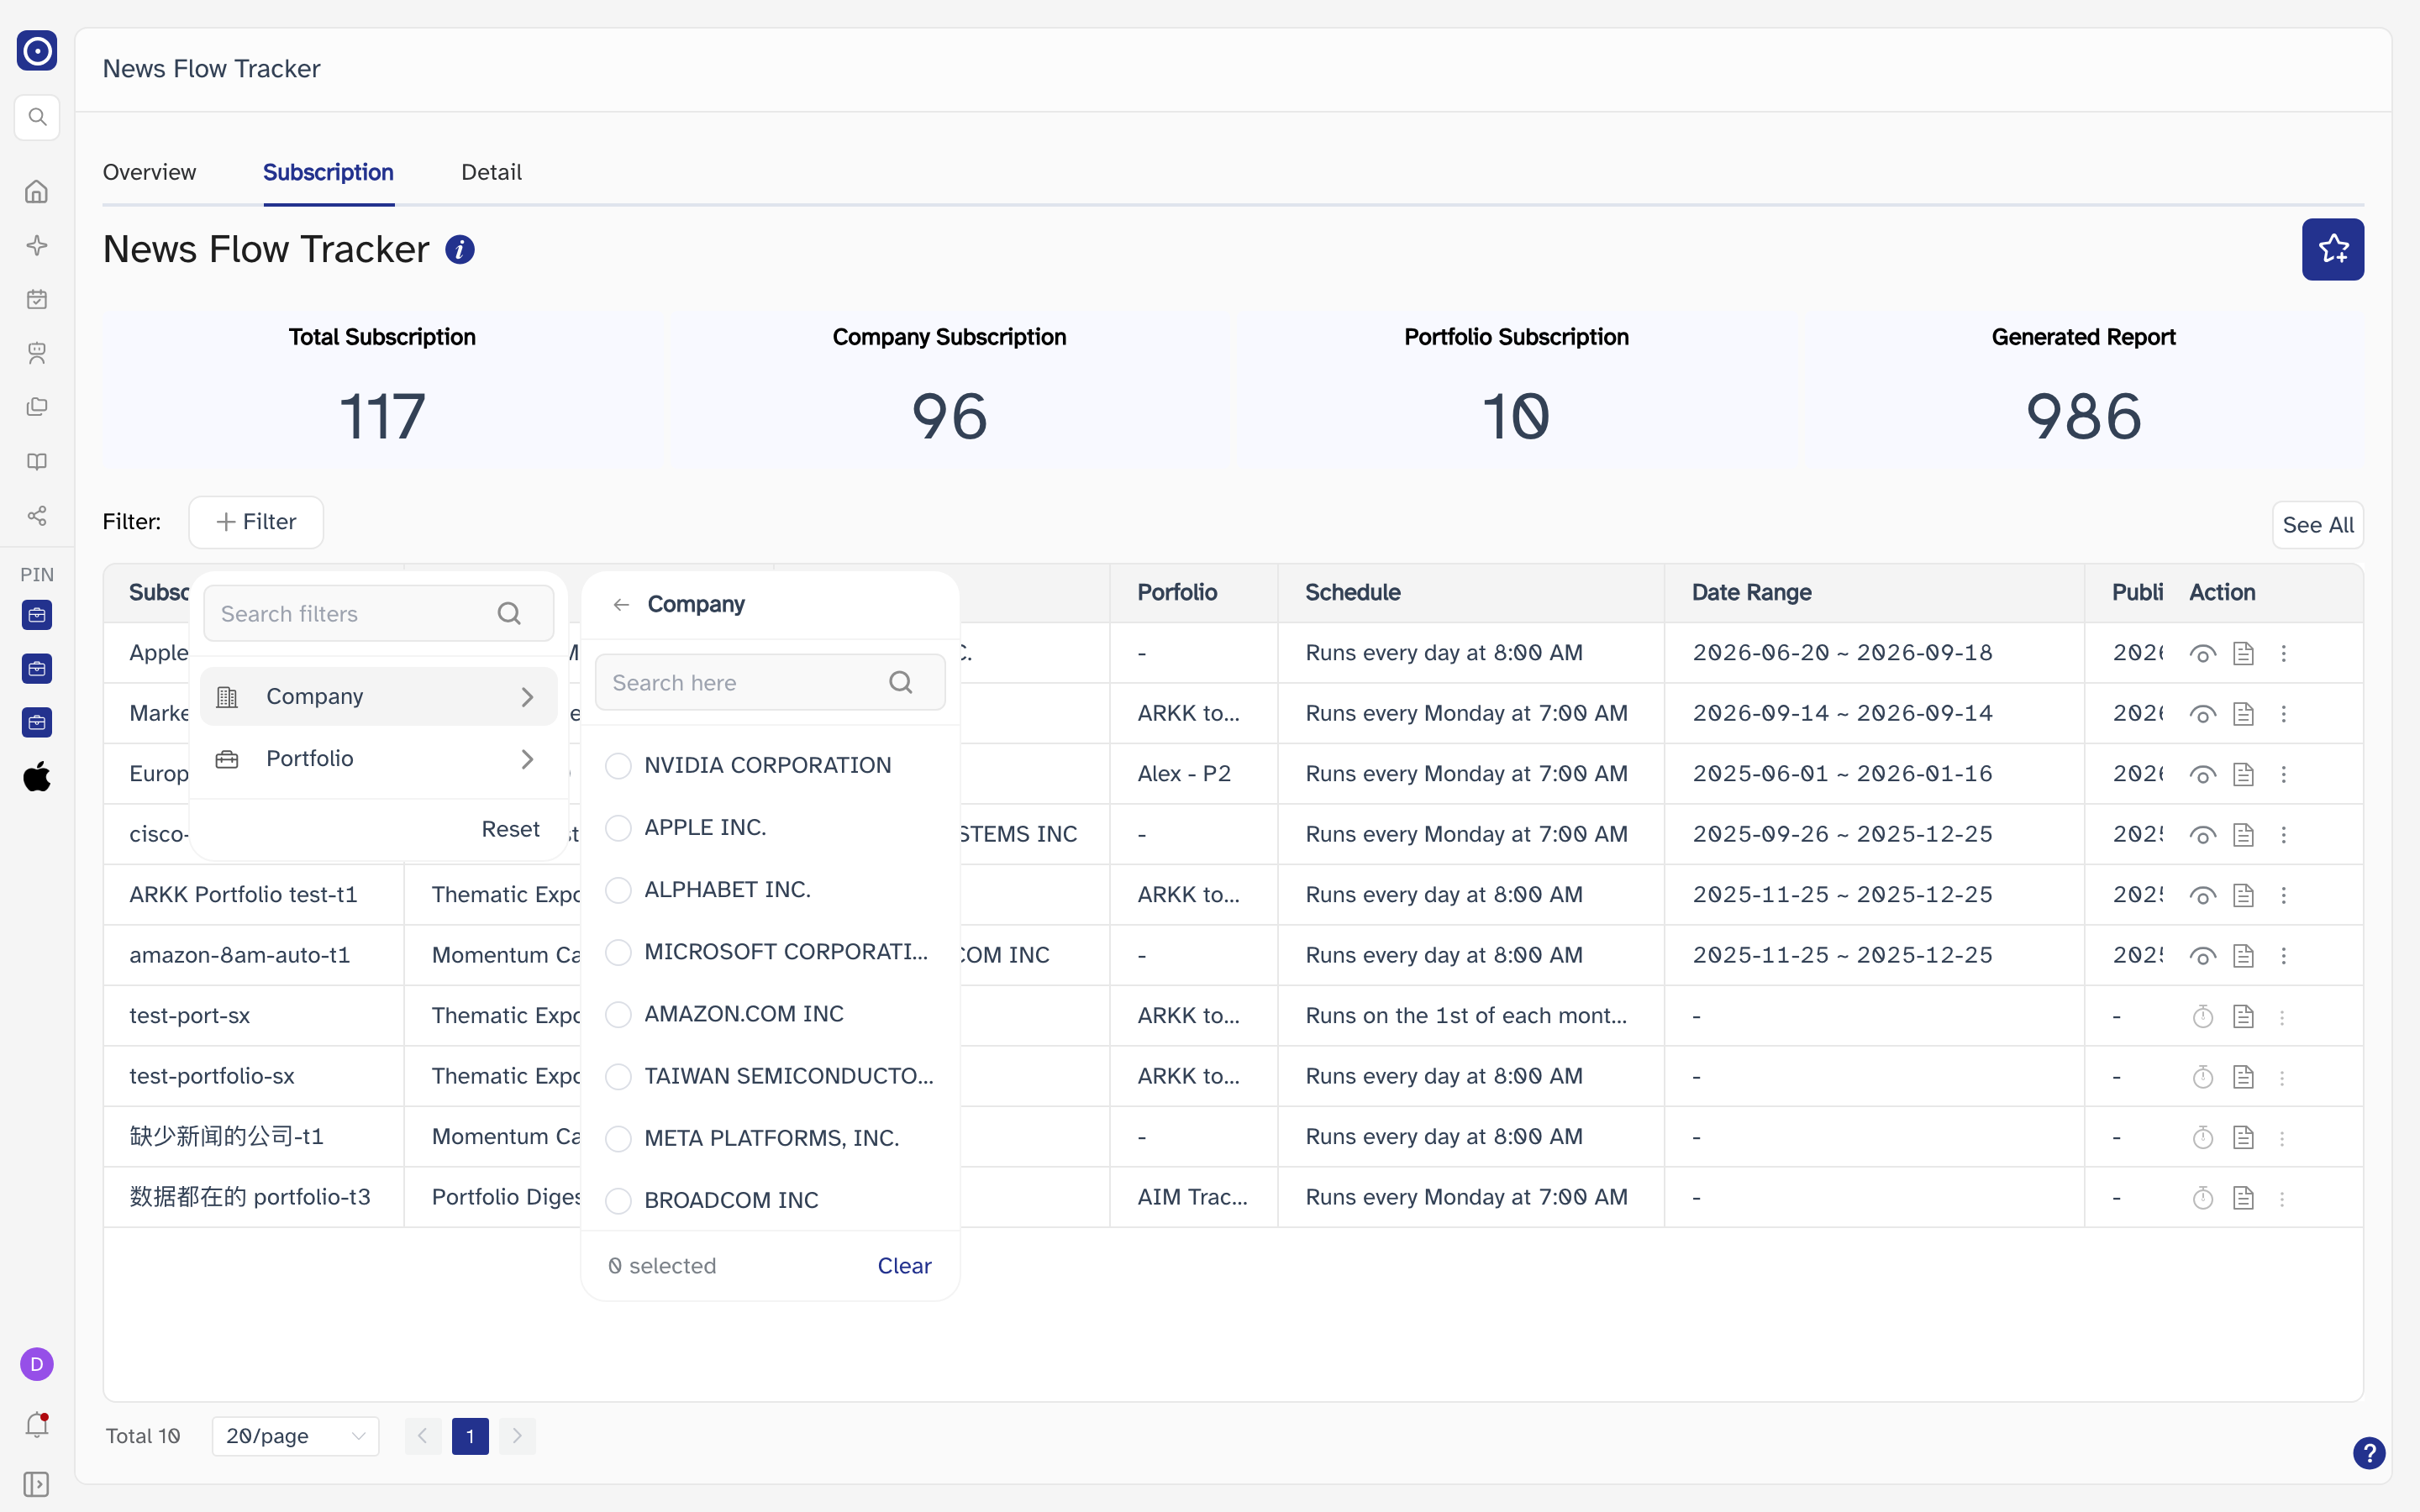
Filter on the row above the table opens the two filters this tab has. Both open a column of choices beside the panel:
| Filter | What it narrows to |
|---|---|
| Company | One company. The column opens with a short list and a Search here box that looks the rest up as you type, three at a time. |
| Portfolio | Any number of portfolios, from the ones loaded with the page. |
A filter you set appears as a chip beside Filter, with an ✕ to drop it. Setting any filter sends the list back to its first page. Reset at the foot of the panel clears every selection at once.
The Action column
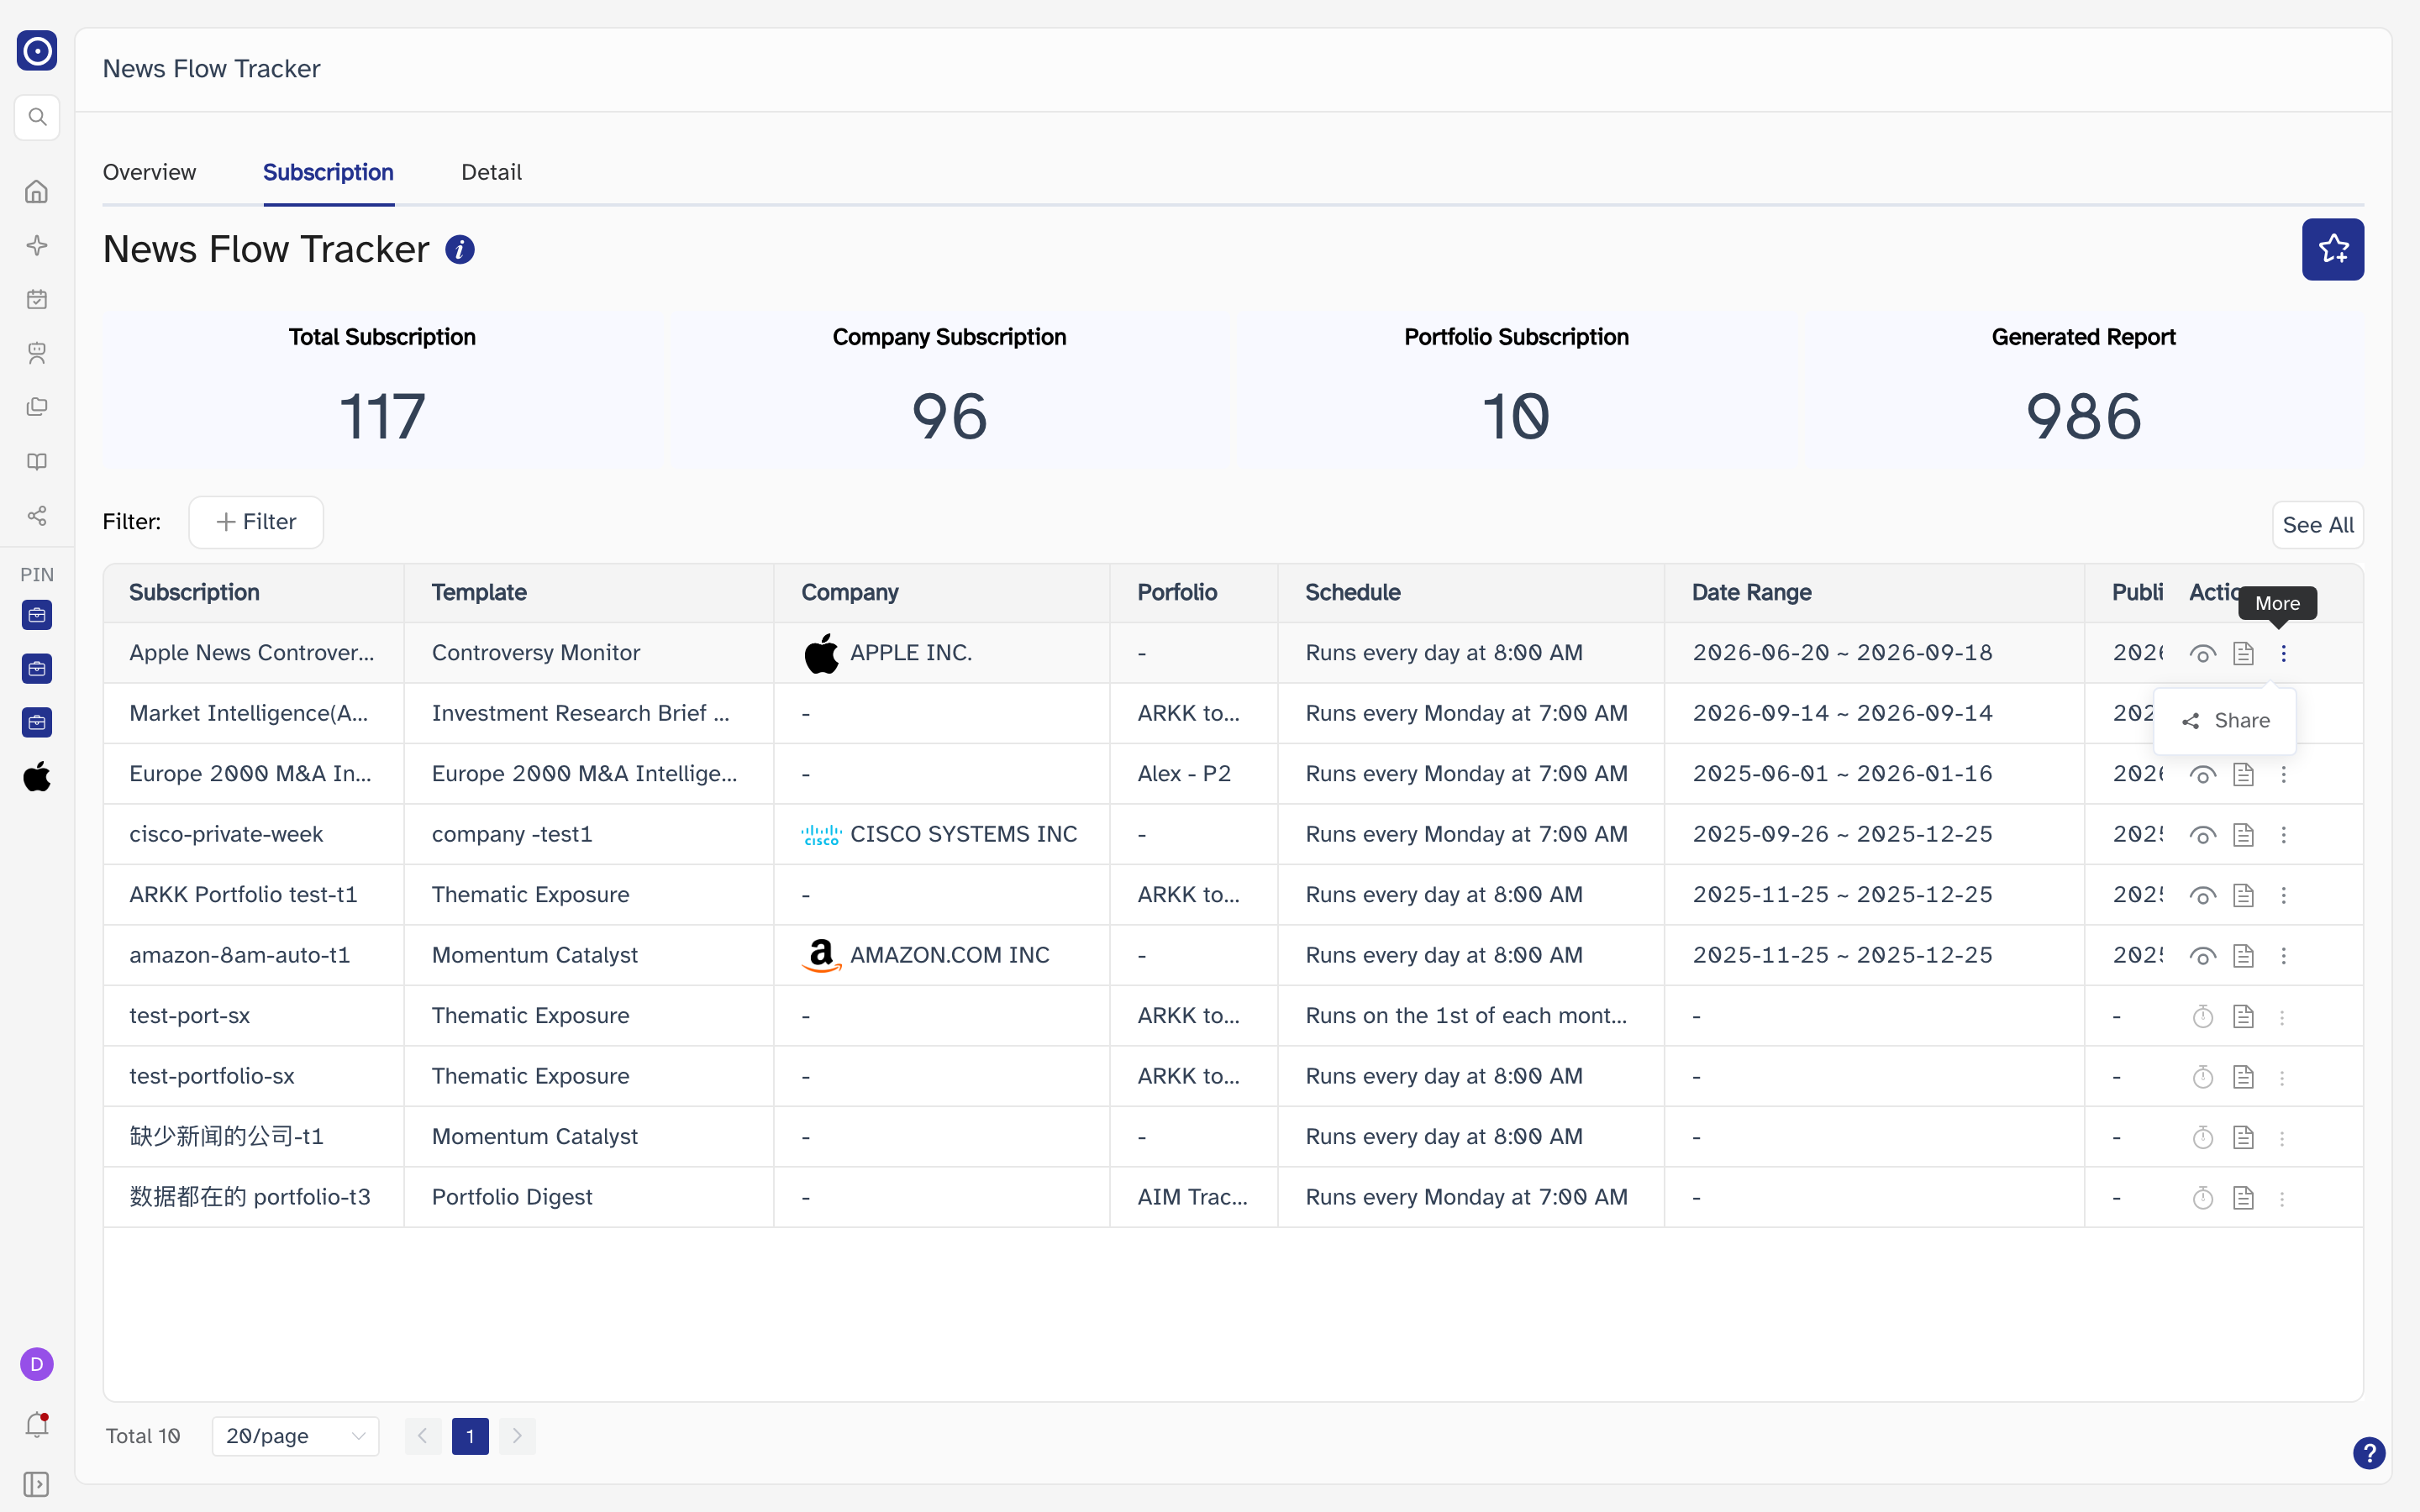
Three icons on every row, and they do not depend on each other.
| Icon | What it does |
|---|---|
| View | Opens that result on Report detail. Replaced by a grey clock until the subscription has produced a result — hovering it then says that results are processed after the subscription runs. The same grey applies to More. |
| History | Opens the run history for this subscription. See the note below — the page it lands on is not filtered the way the link suggests. |
| More | One entry, Share. Creates a public link to the result and copies it to your clipboard; it also appears on Share. |
Both build a link carrying this subscription's agent, template and company or portfolio — and the page they open ignores every one of those parameters. You always arrive at Agent Subscription History, the flat list of every run on the account, with the newest at the top. Narrowing it is up to you once you are there.
That page is not covered in this manual yet; the link works, it is the documentation that is missing.
See All
Sits at the right end of the filter row, level with Filter. It opens the same run history as the row's History icon, minus the parameters — this list shows one row per subscription, the history shows every run of every one of them.
Subscribing a company or a portfolio
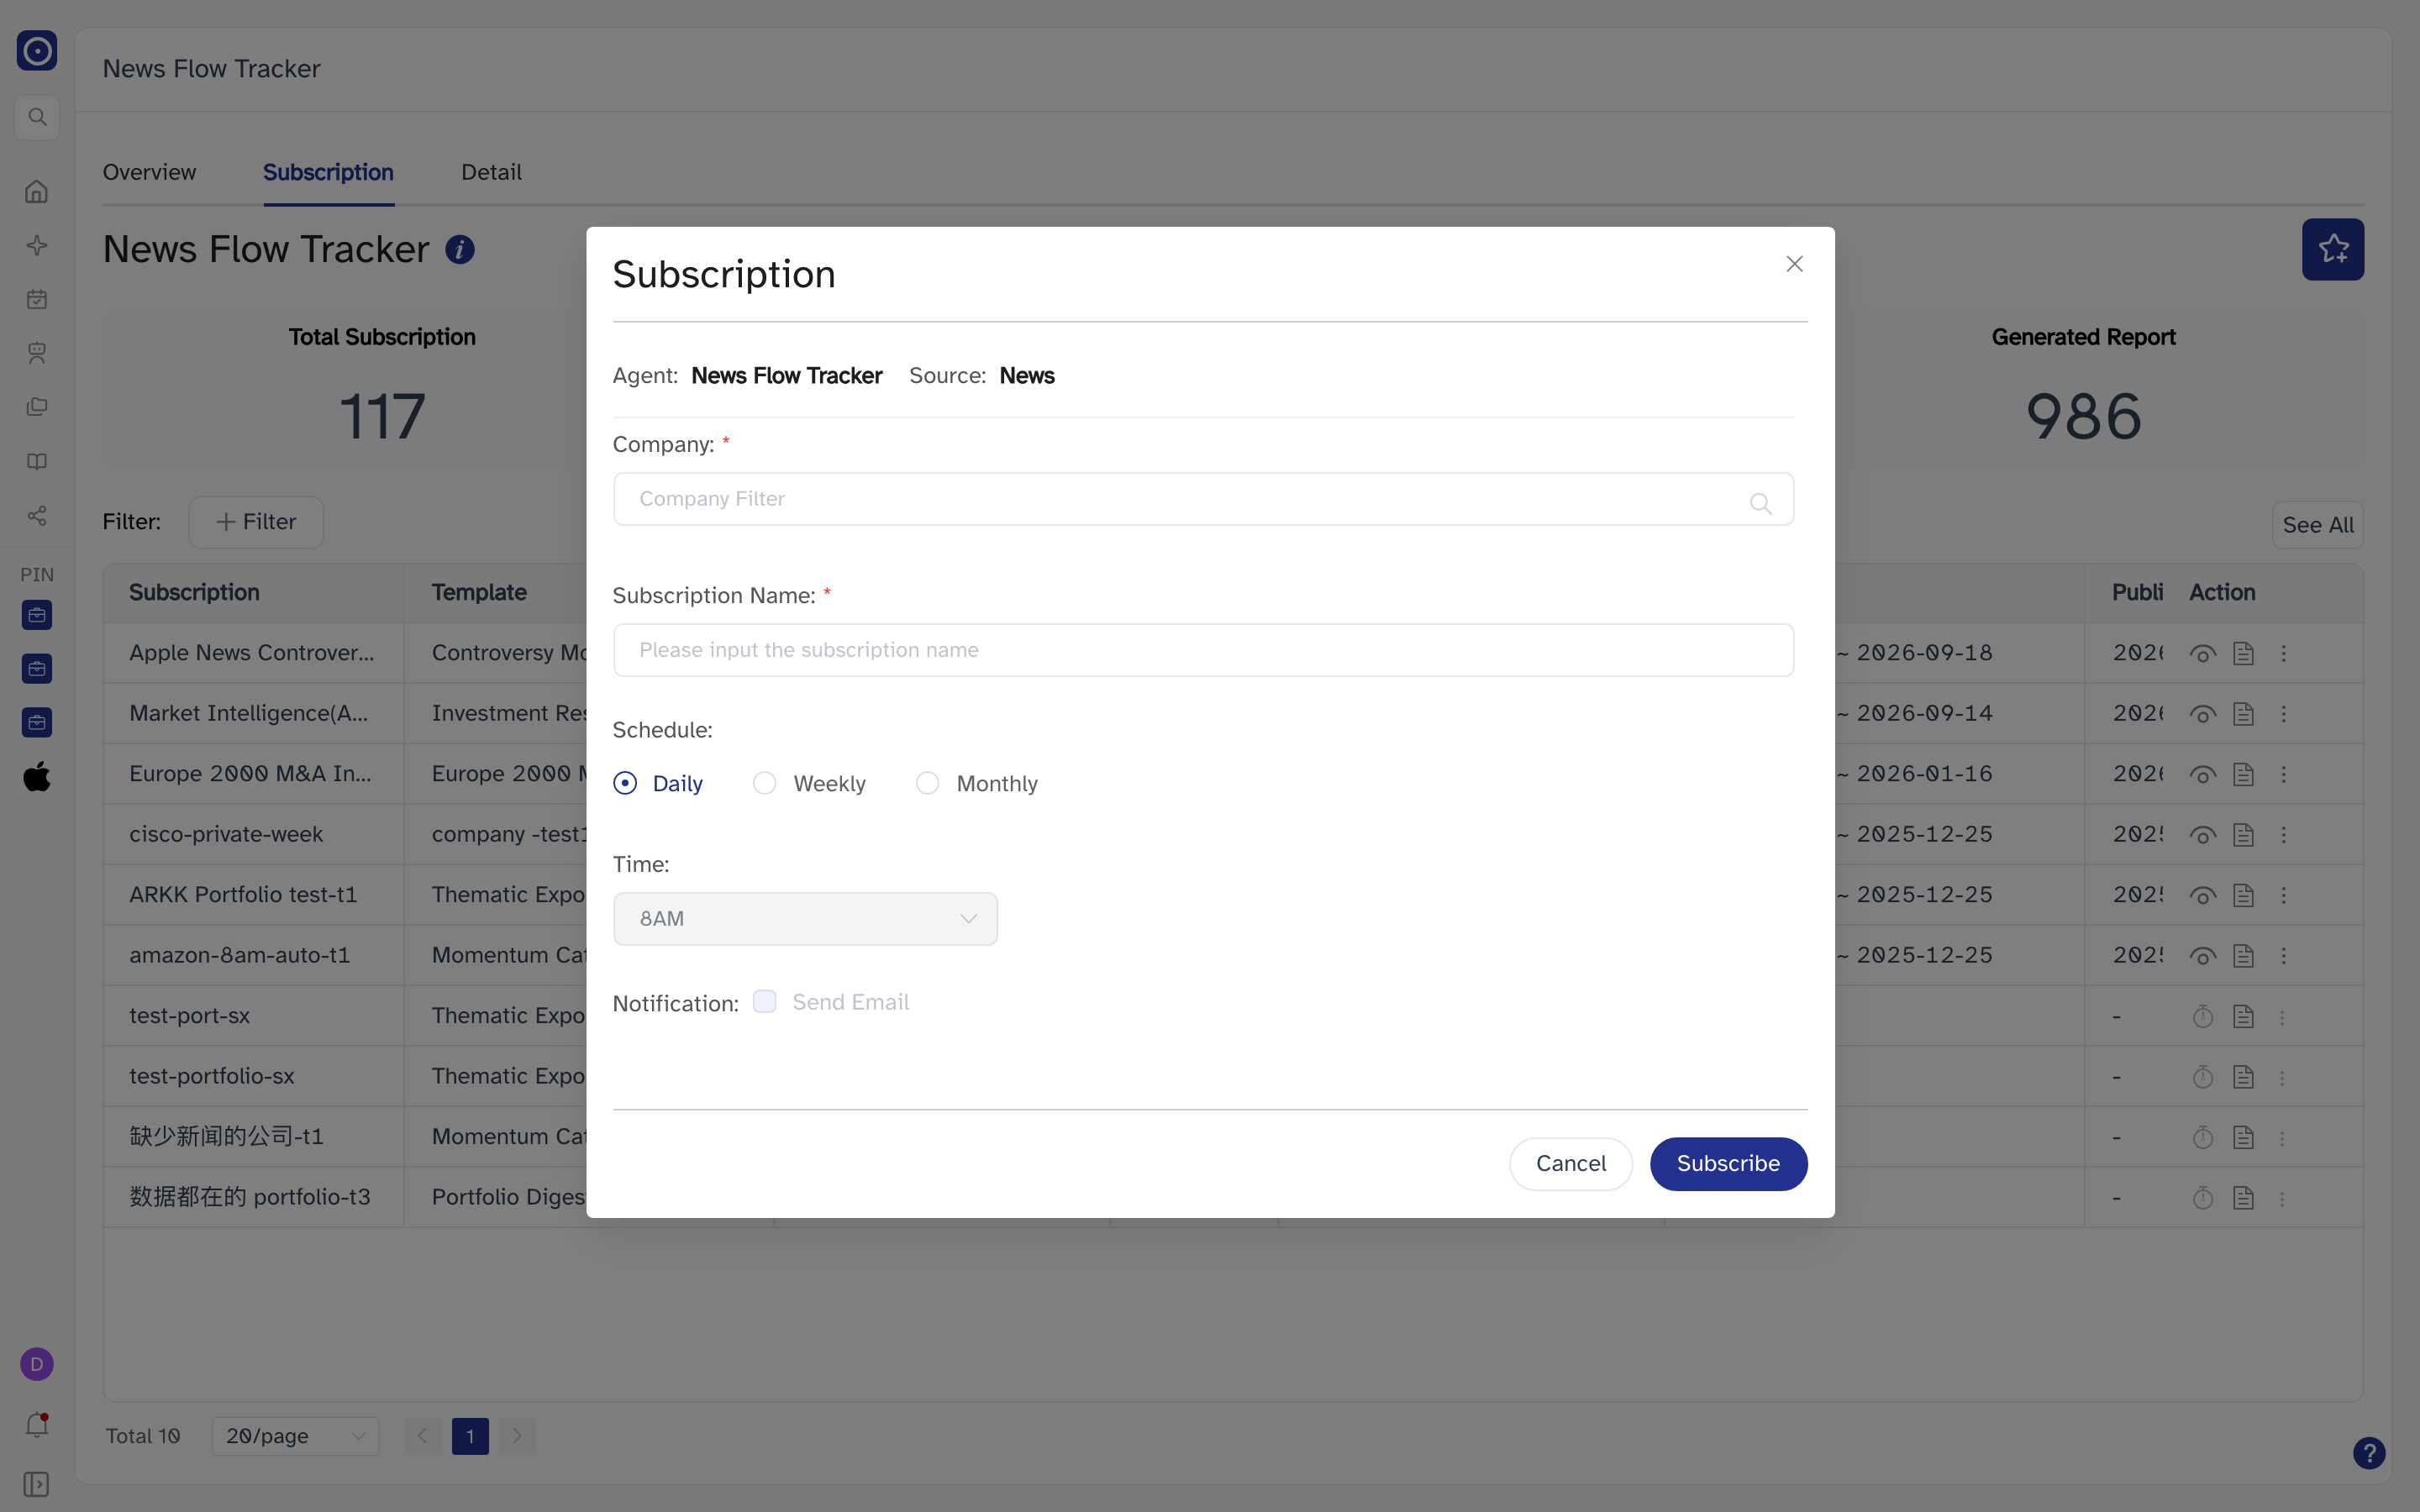
Company and Portfolio in the header's dropdown open the same form, differing in the one field at the top. Both create a recurring job for this agent.
| Field | What it does |
|---|---|
| Agent / Source | A read-only line naming the agent and where the coverage comes from — News Flow Tracker and News. |
| Company | The company to watch. A search box, not a list; the choice is required. |
| Portfolio | The portfolio to watch. A dropdown of the portfolios on the account; required. This is the field that replaces Company when you came in through Portfolio. |
| Subscription Name | What the row will be called in the list above. Required. |
| Schedule | Three radio buttons: Daily, Weekly or Monthly. |
| Day / Date | Appears only for Weekly and Monthly respectively, and is fixed — this far down the agent's scale, the day is not yours to choose. |
| Time | The hour it runs, on a fixed list from 1AM to 12PM. |
| Notification | Send Email, greyed out. Delivery is fixed for this agent and cannot be changed here. |
Subscribe commits; Cancel closes without creating anything. The new row does not appear immediately — the first result has to be produced first, so expect a dash in its Date Range until the subscription has run once.
Detail
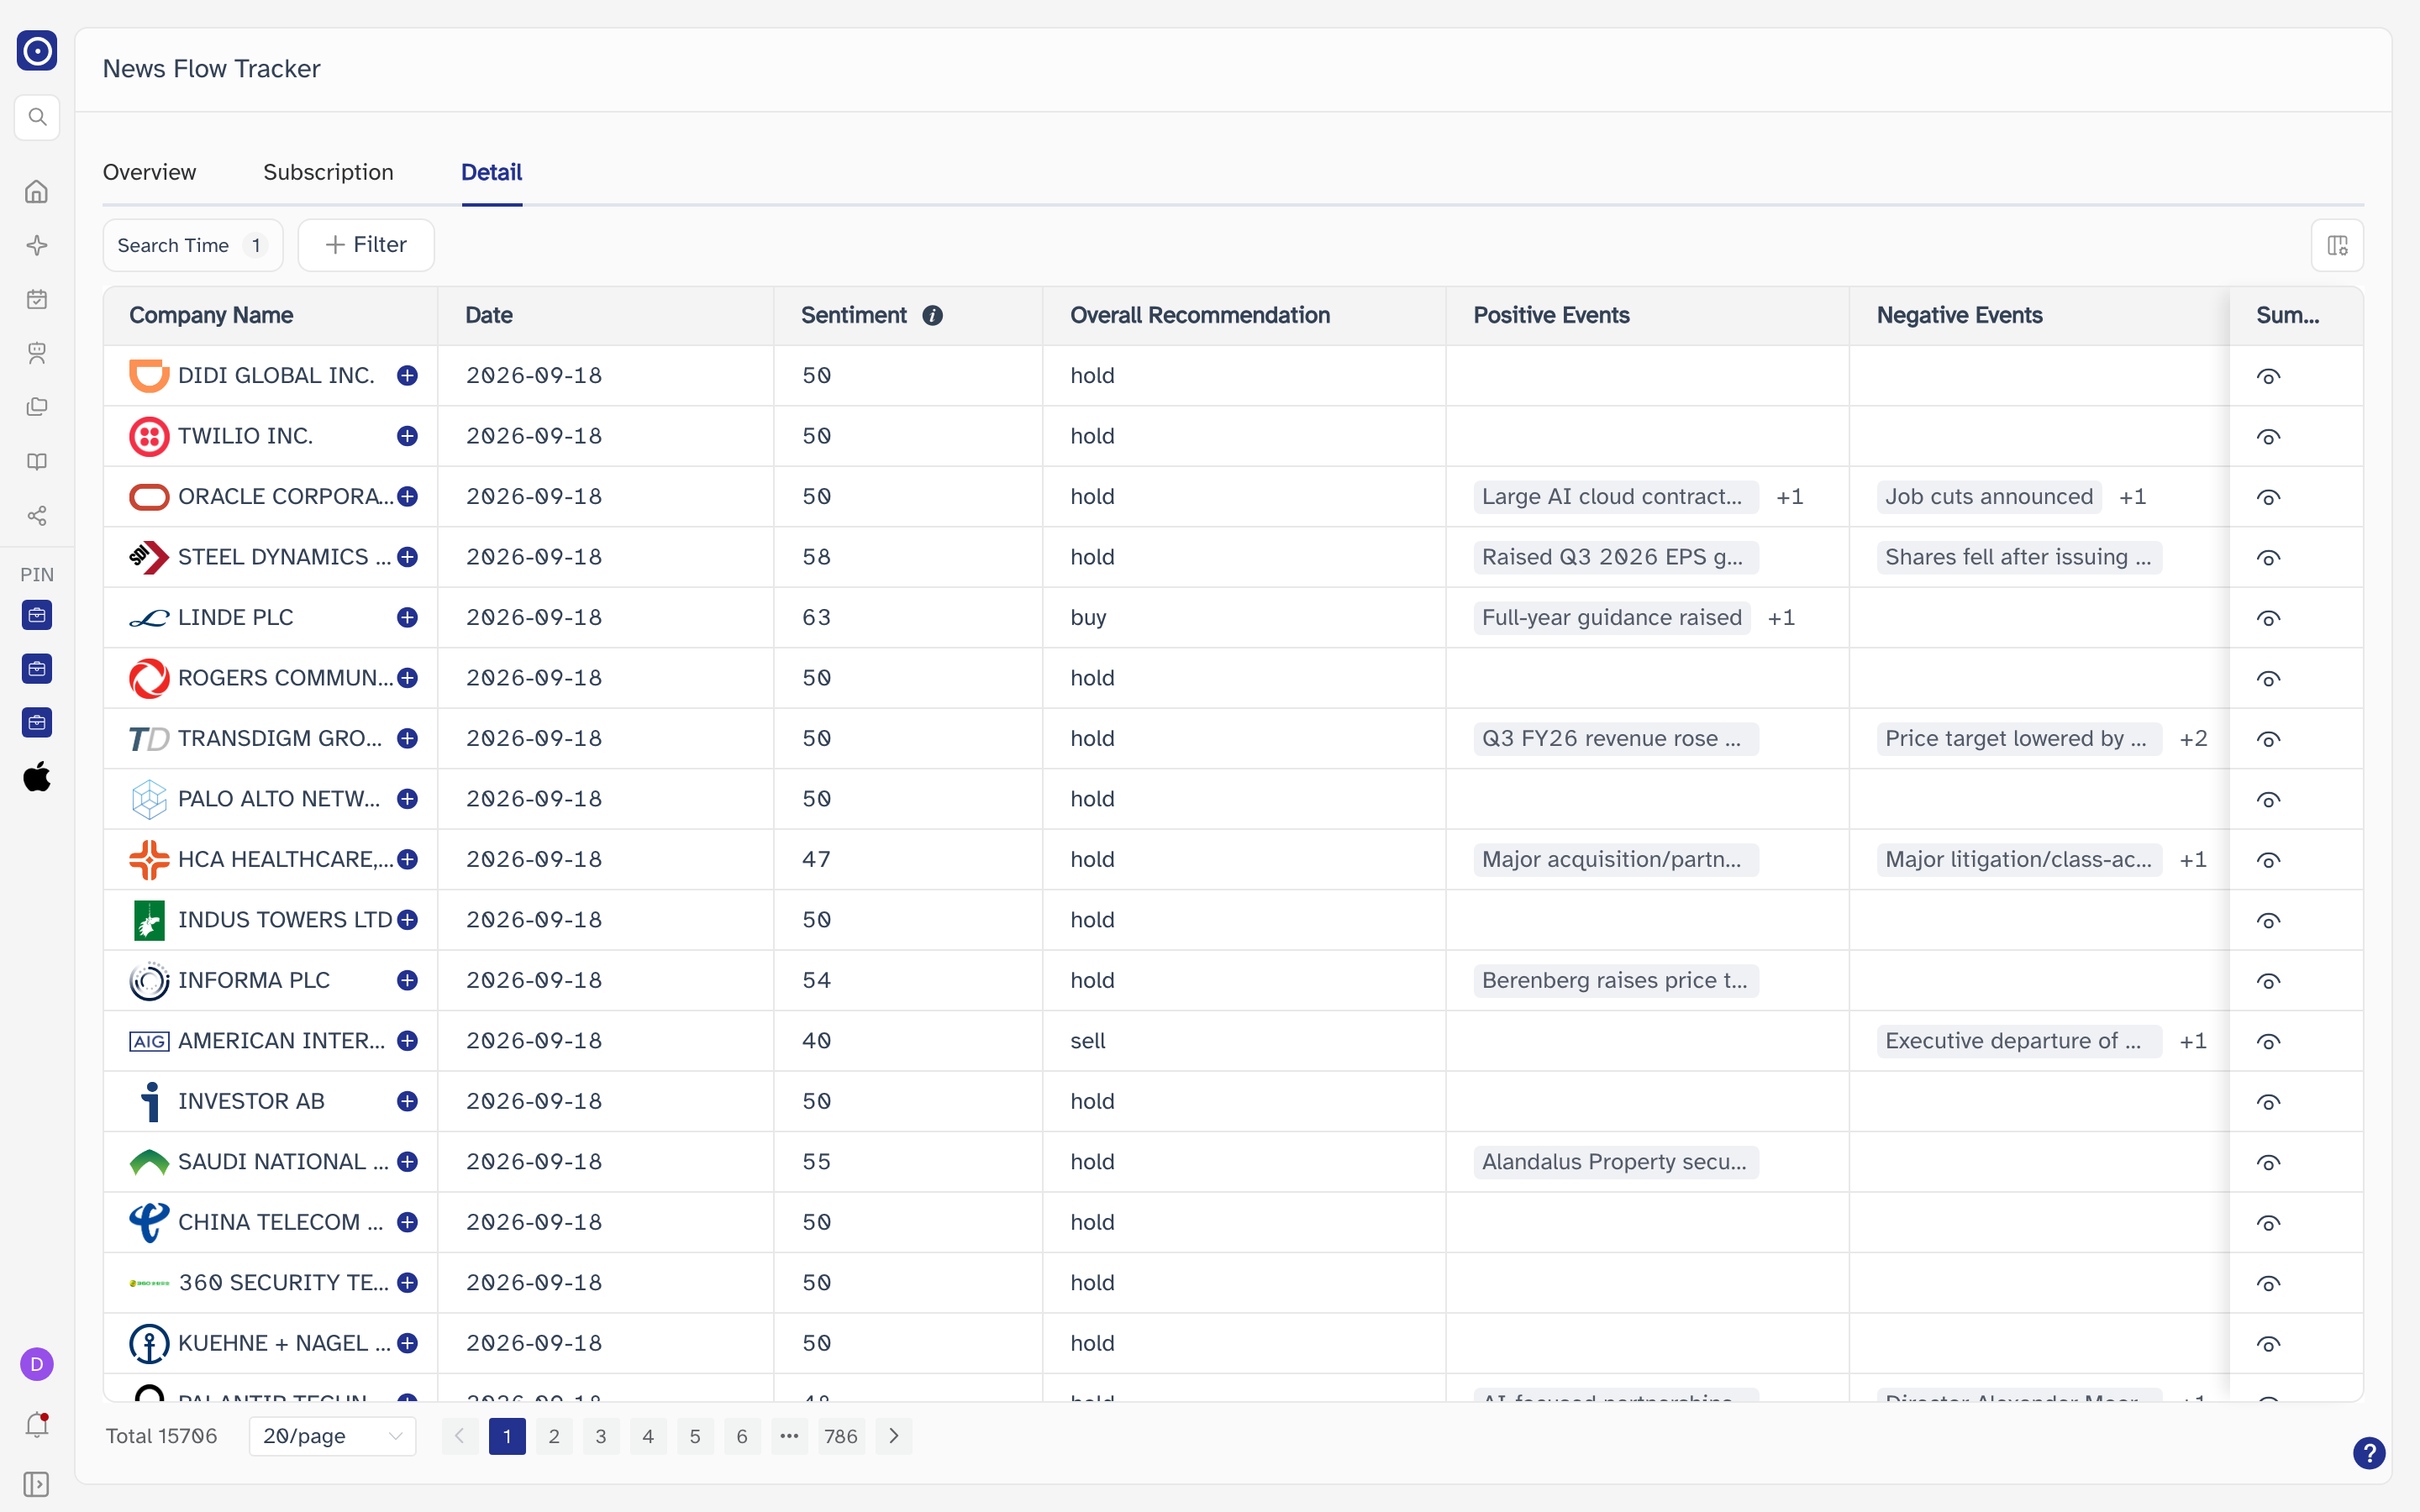
The tab the Dashboard panel and News Research's Souce → More land on: one row per company per run, with the whole record behind a click. This is the tab that answers "what did the news say about this one company on this one day".
News Research sends a company and a date range along with the More link, and the address does carry them — but this page reads only the tab and the agent. You land on Detail with the default seven-day window and no company chosen, whatever you had selected over there.
Filtering the records
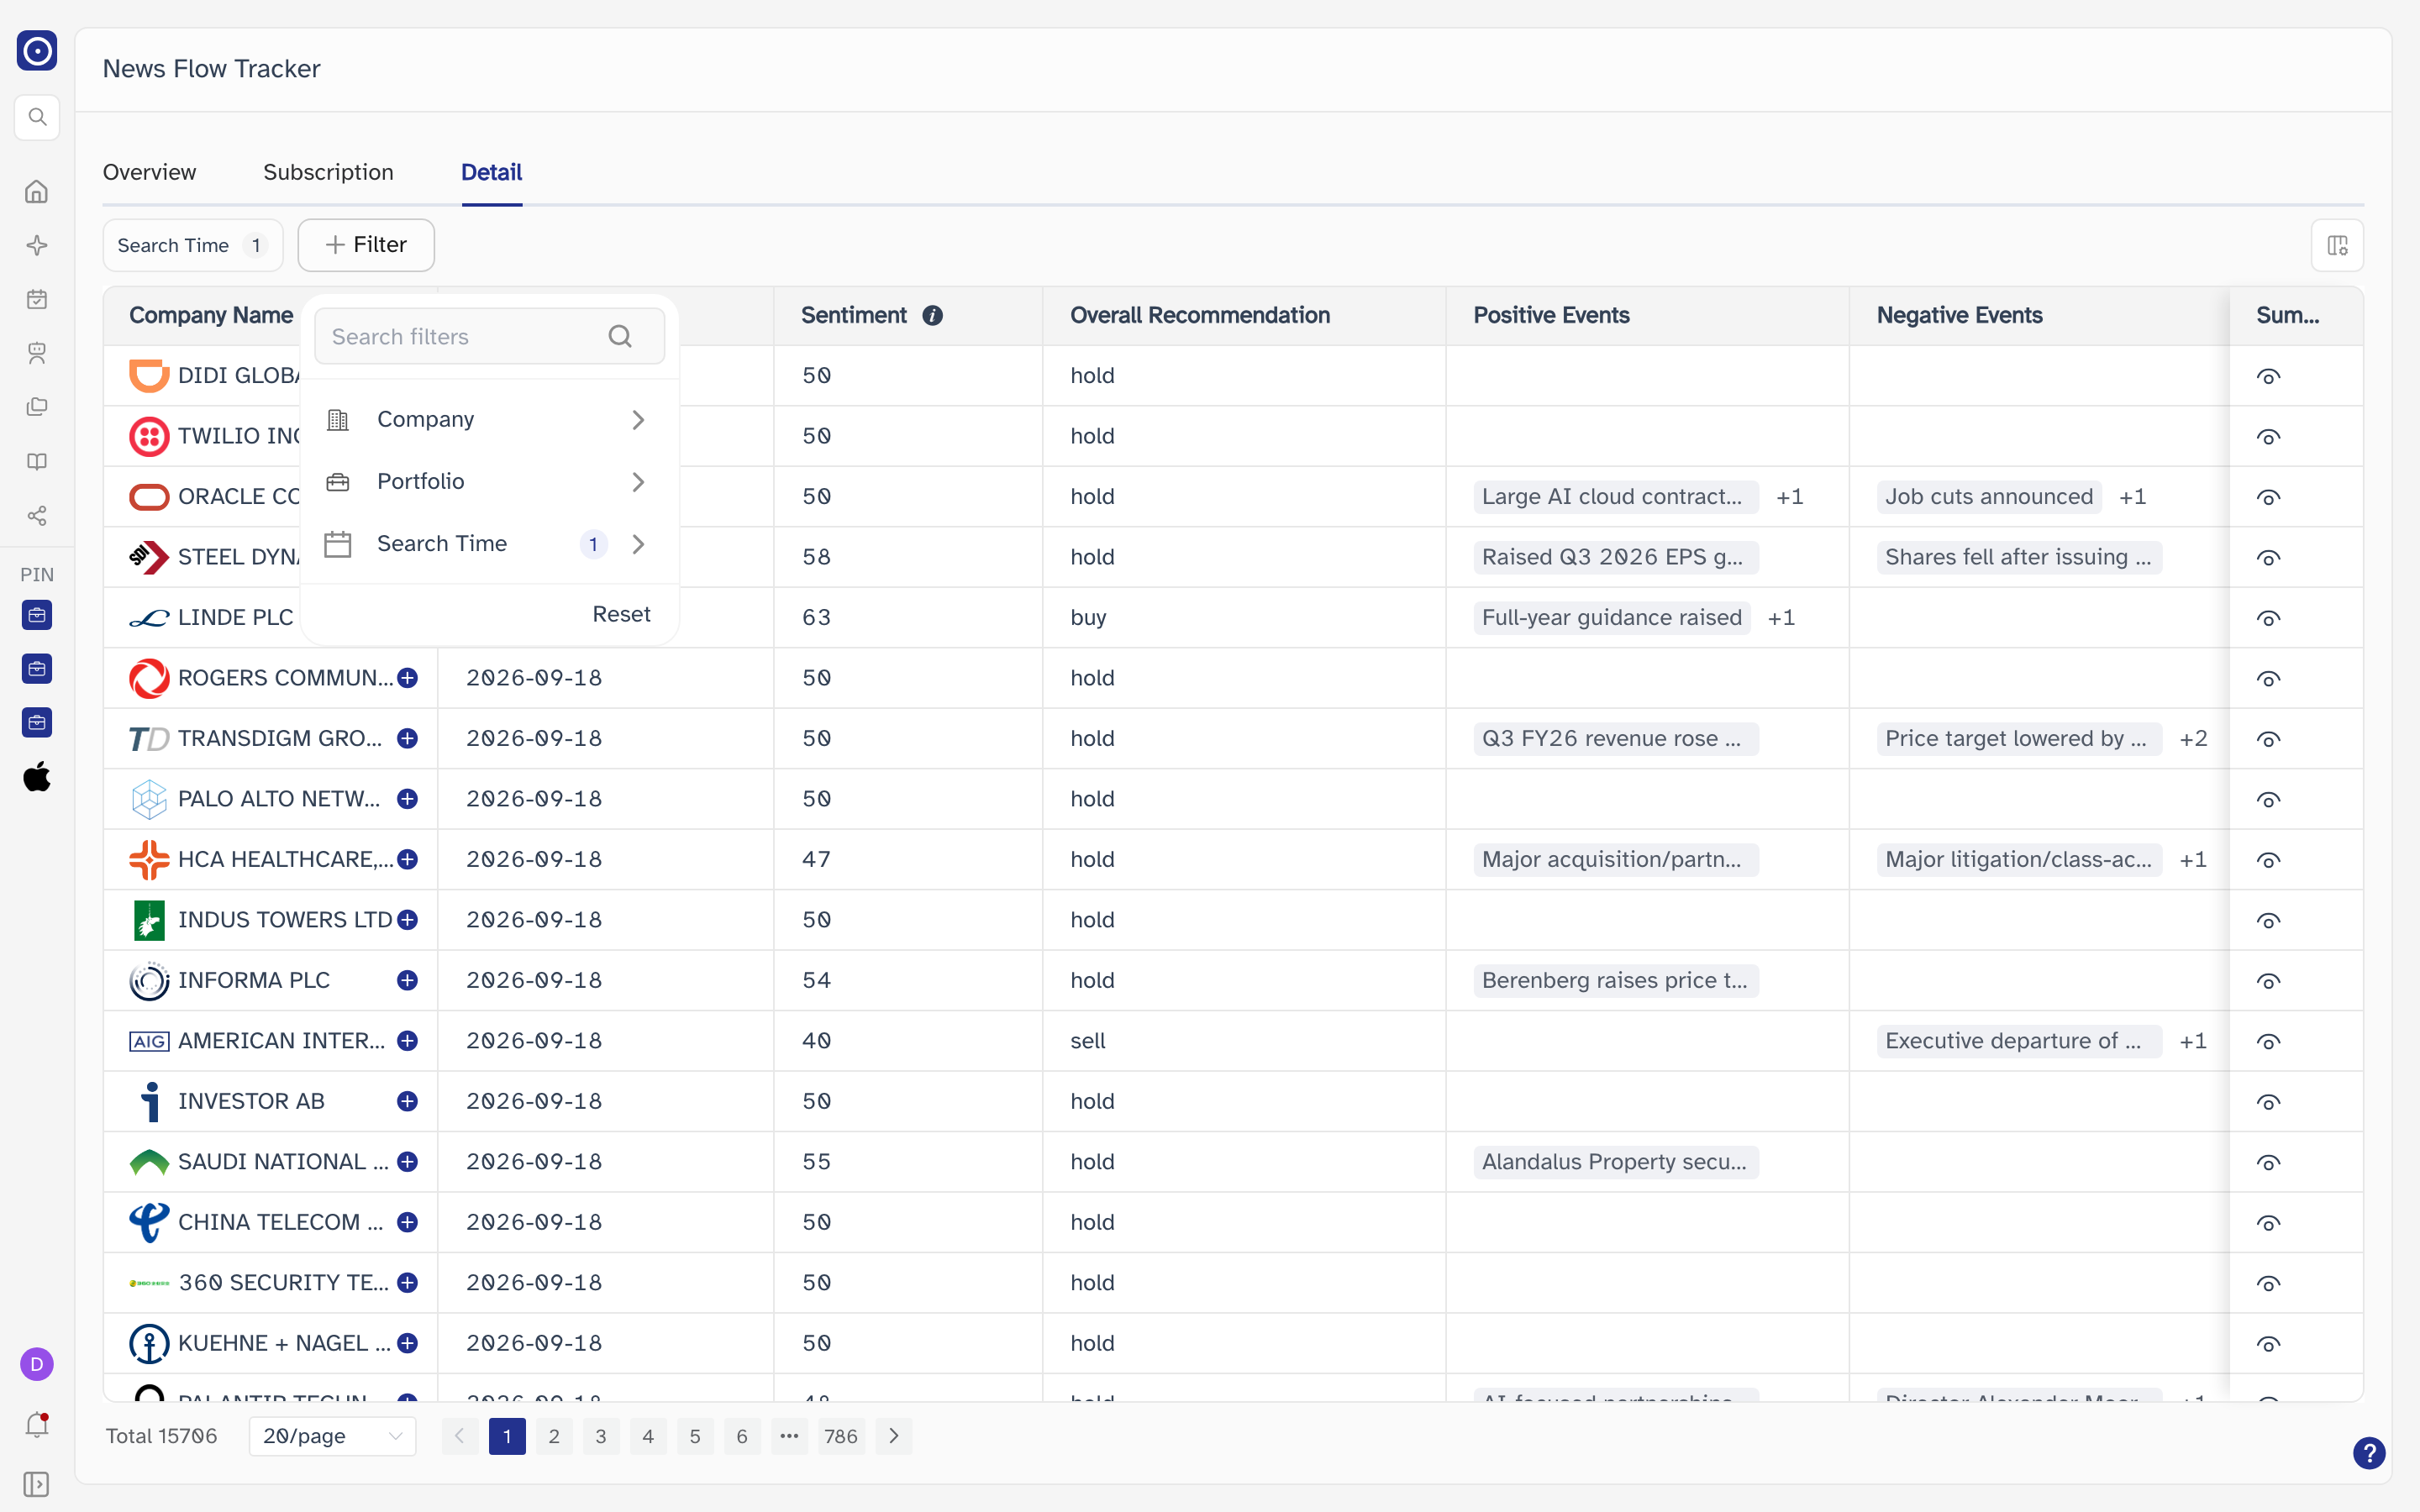
This tab has three, one more than Subscription:
| Filter | What it narrows to |
|---|---|
| Company | One company, chosen from a Search here box. |
| Portfolio | Any number of portfolios. |
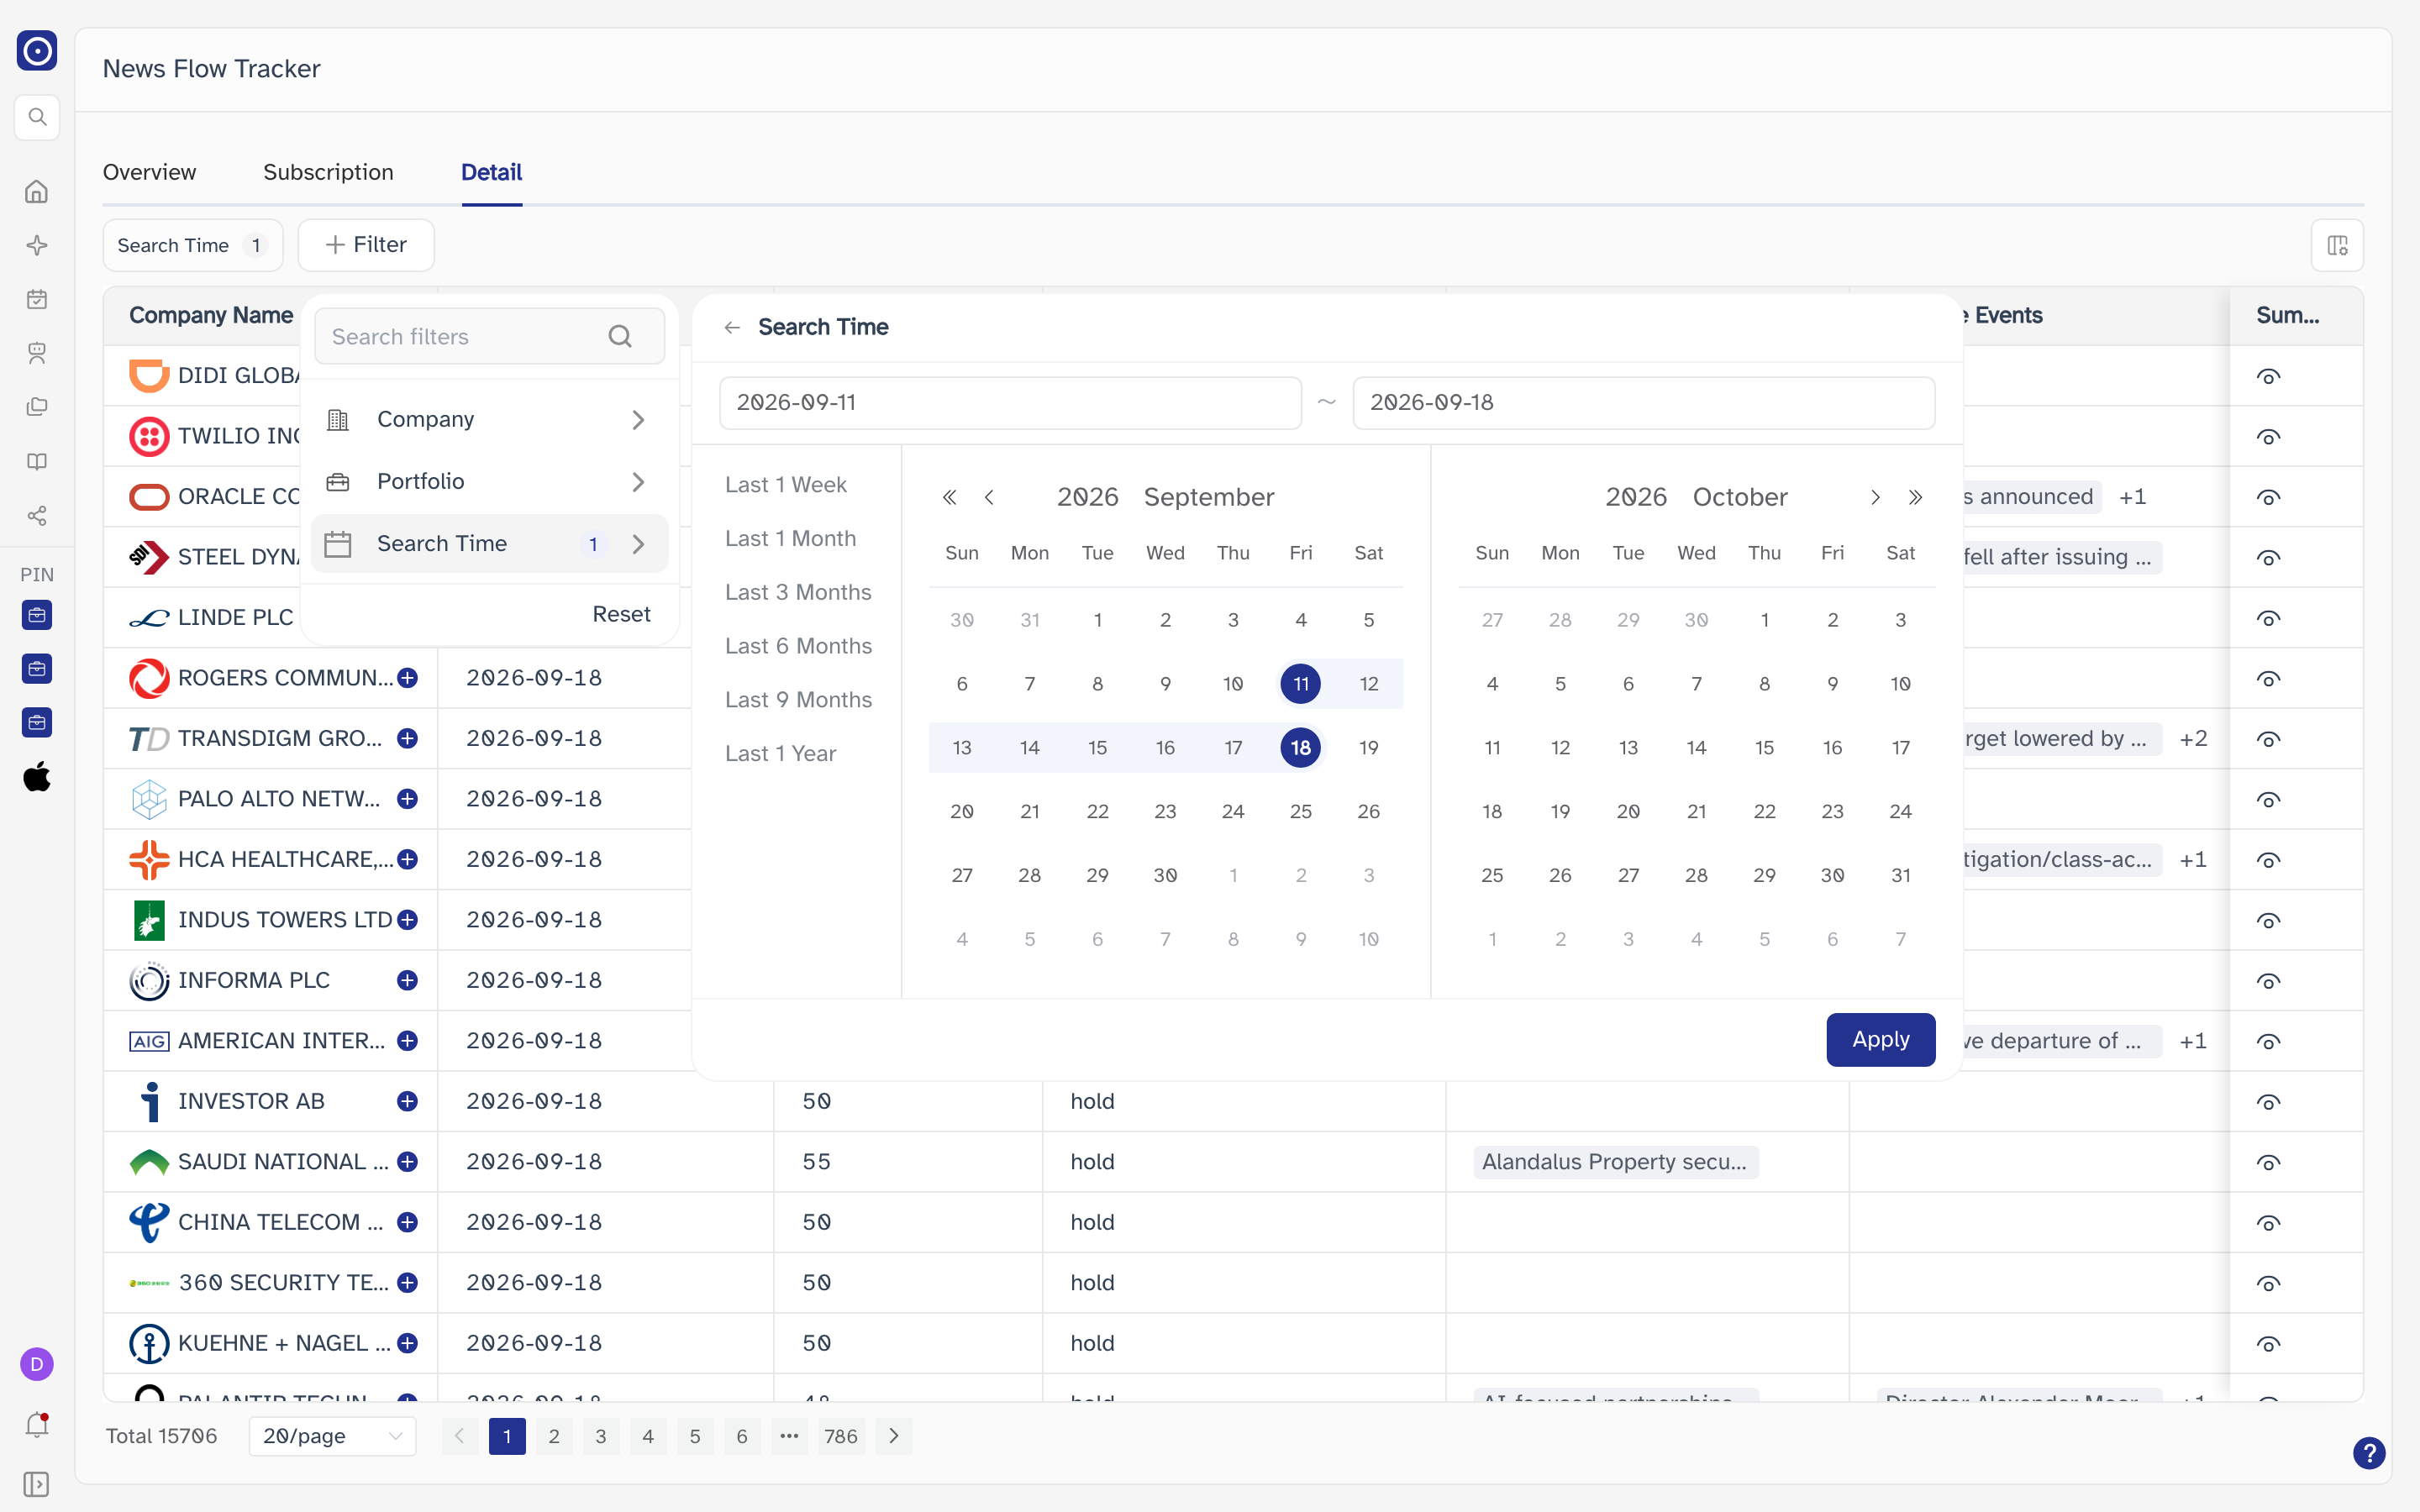
| Search Time | A date range, preset to the last seven days and shown as a chip from the moment the tab opens. |
Search Time is the odd one: it cannot be dropped, only changed — its chip has no ✕ and the panel offers no Clear for it, though Reset will still put it back to the default week.
Choosing the columns
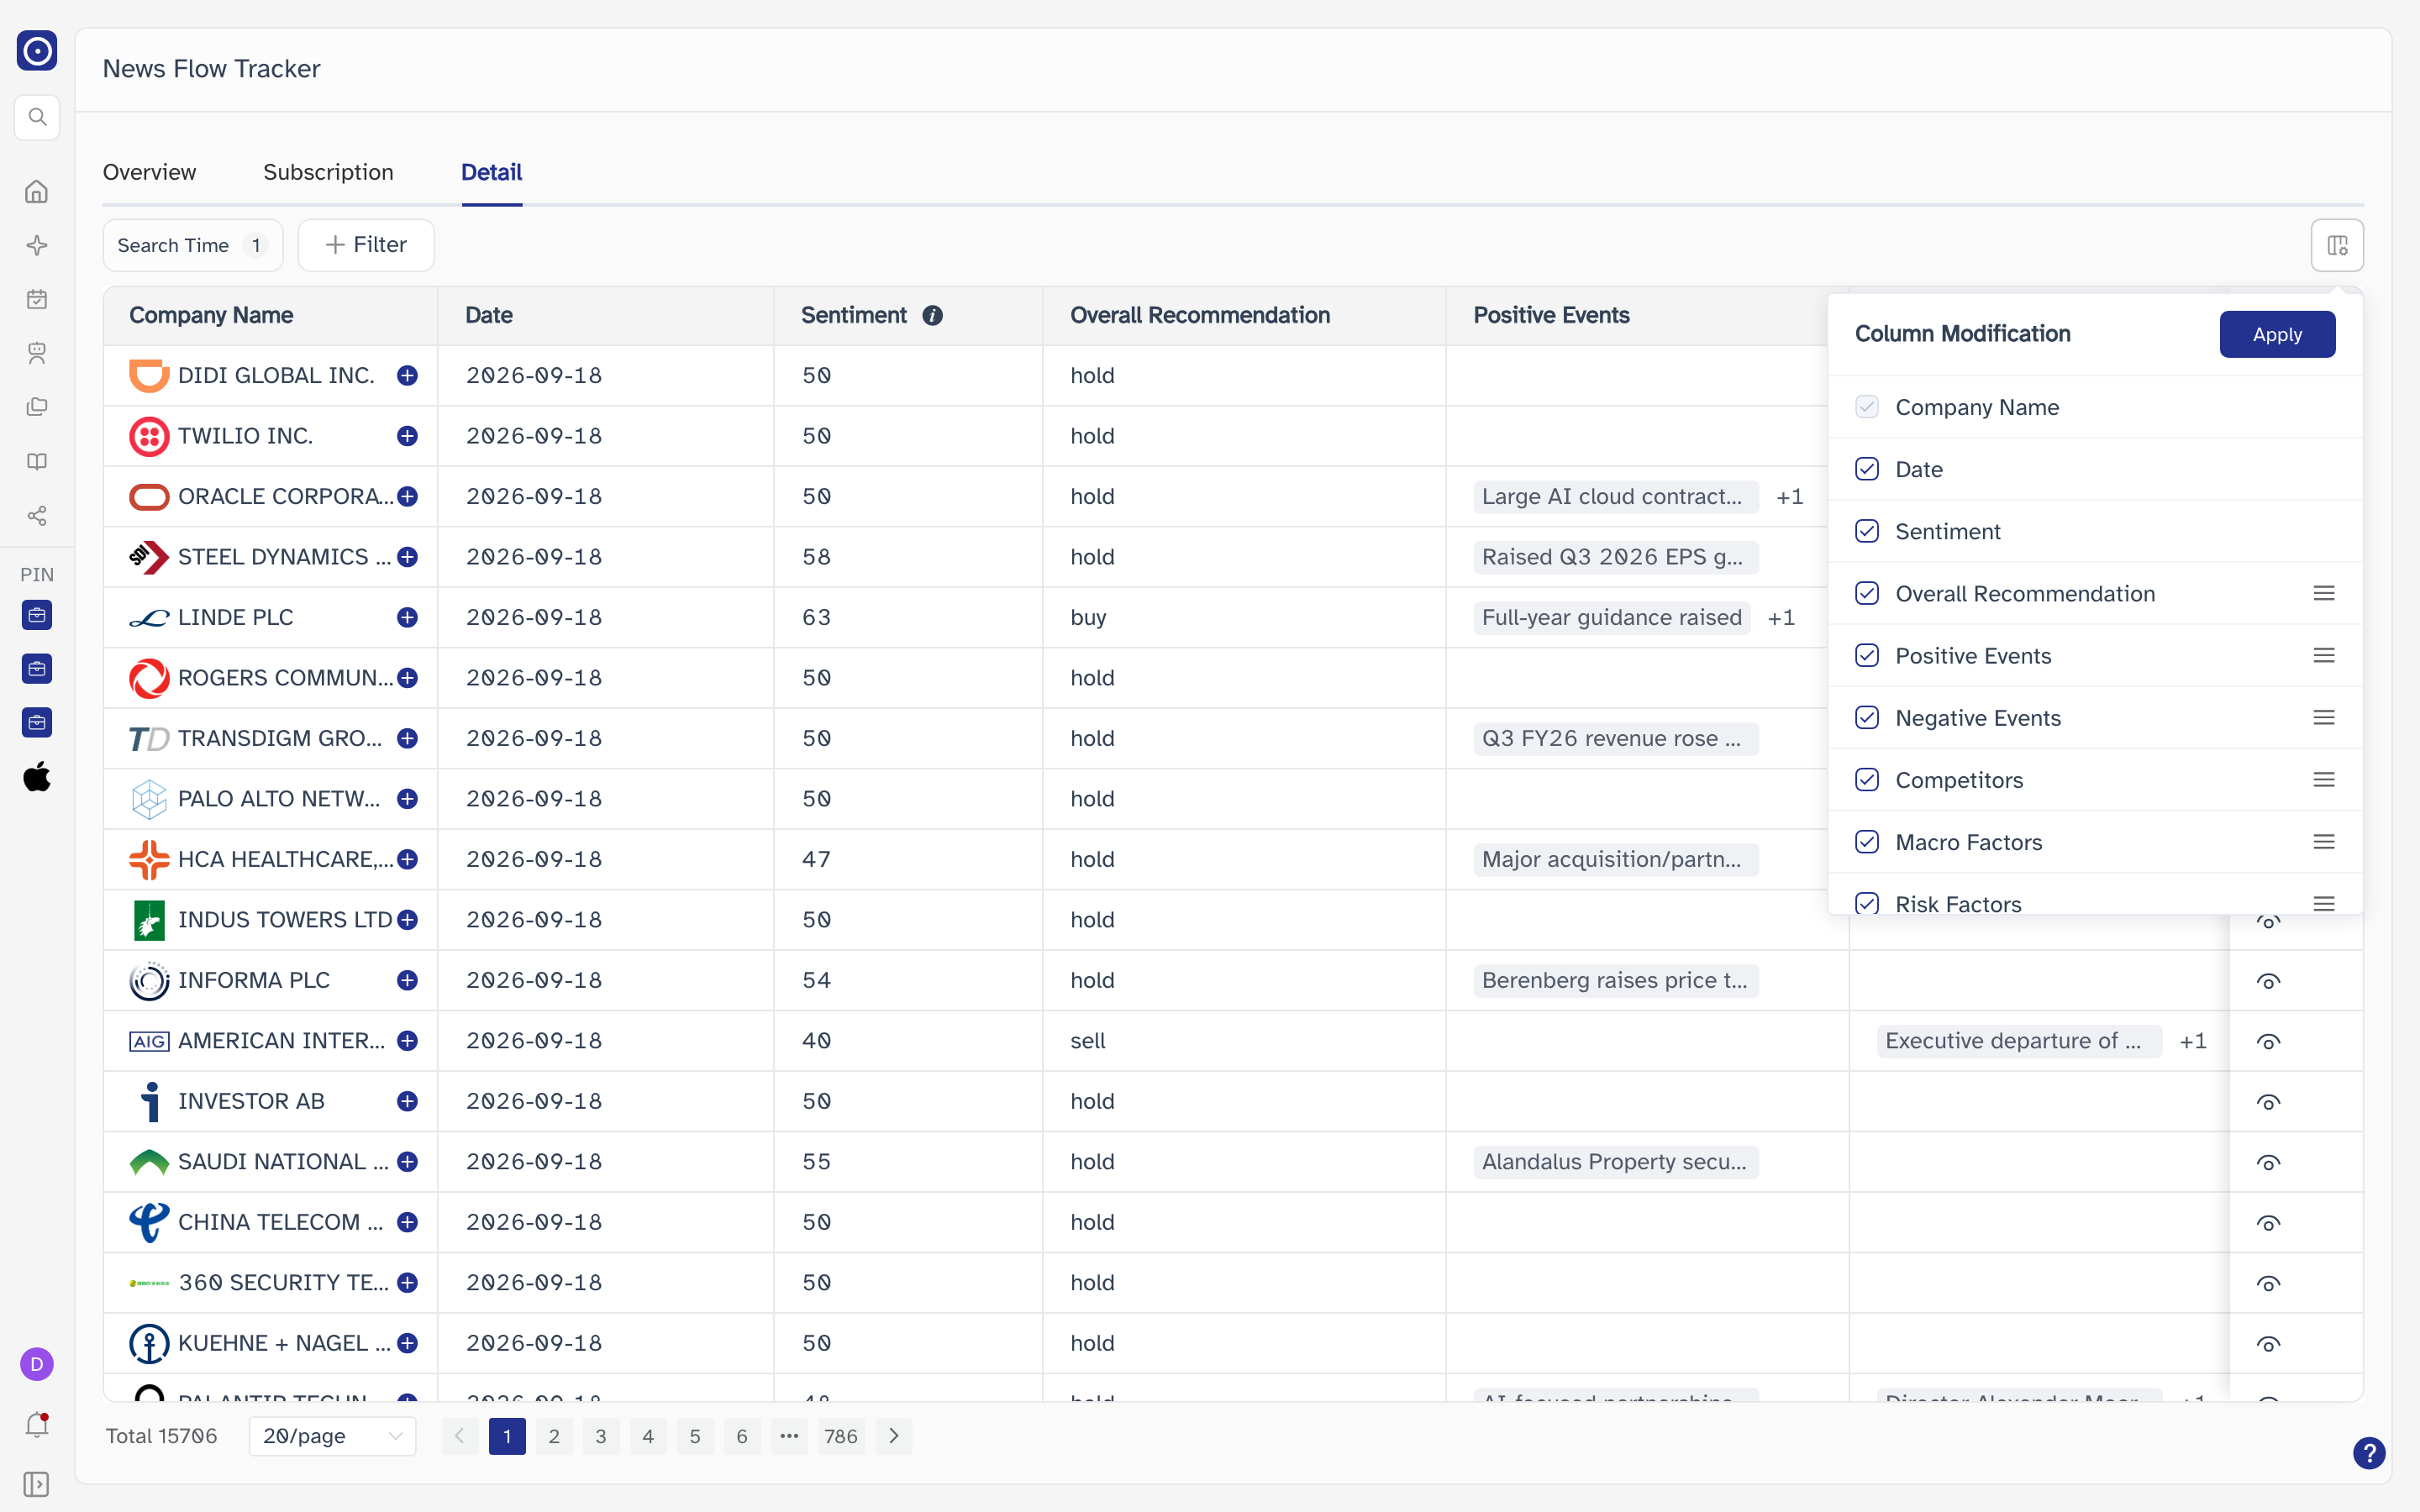
The icon at the right of the filter row opens Column Modification, which lists every column with a checkbox. Unticking one removes it from the table and gives the rest more room; Apply makes the change and redraws the table.
Ten columns are available: Company Name, Date, Sentiment, Overall Recommendation, Positive Events, Negative Events, Competitors, Macro Factors, Risk Factors and Summary. The first three and Summary are pinned to the edges and stay put as the middle scrolls sideways, which is also why those four are the ones with nothing to drag them by. The very first — Company Name — is the one column you cannot switch off: its checkbox is greyed out.
Reading a row
Company Name opens the company's page. The small button after the name opens the same two-entry menu as elsewhere in Orbit — Add to Watchlist and Add to Portfolio; see Explore for what those do.
The heading of Sentiment carries an information icon. It opens a reference table, not a tooltip: the score bands run 0–44 → SELL, 45–59 → HOLD and 60–100 → BUY, with 50 reserved for a company whose coverage contained no qualifying event.
Sentiment, Positive Events,
Negative Events, Competitors,
Macro Factors and Risk Factors all show only the first entry,
with a +n beside it. Hovering the cell lists the rest.
Summary is the narrow column pinned to the right, and its eye icon opens that row's page — see News flow detail. The same icon appears on every row, whether or not the record has anything to summarise.
Records run long: the capture above is twenty rows out of 15,706 for the account — 786 pages of them. The Search Time window is what holds that down to something you can scan, which is why it starts set rather than empty.
Discover It
The information icon beside the page title opens an overlay covering the whole page: a short explanation of what the agent is for, a video, and a carousel of the templates it ships with. The overlay is not attached to a single tab; it opens over whichever one you are on and closes with the ✕ at its top right.
The carousel's title and paragraph change with the card you are on, and there are seven cards — Company Deep Dive, Competitive Intelligence, Controversy Monitor, Momentum Catalyst, Portfolio Digest, Event Aggregator and Thematic Exposure. Clicking a card's image opens that template's example as a shared page in a new browser tab, so you can see the output before subscribing.
The Subscription button inside the overlay is the same dropdown as on the page, and Company and Portfolio open the subscription dialog on top of the overlay — you do not have to close it first. Only Manage Subscription leaves the page, for Schedules.
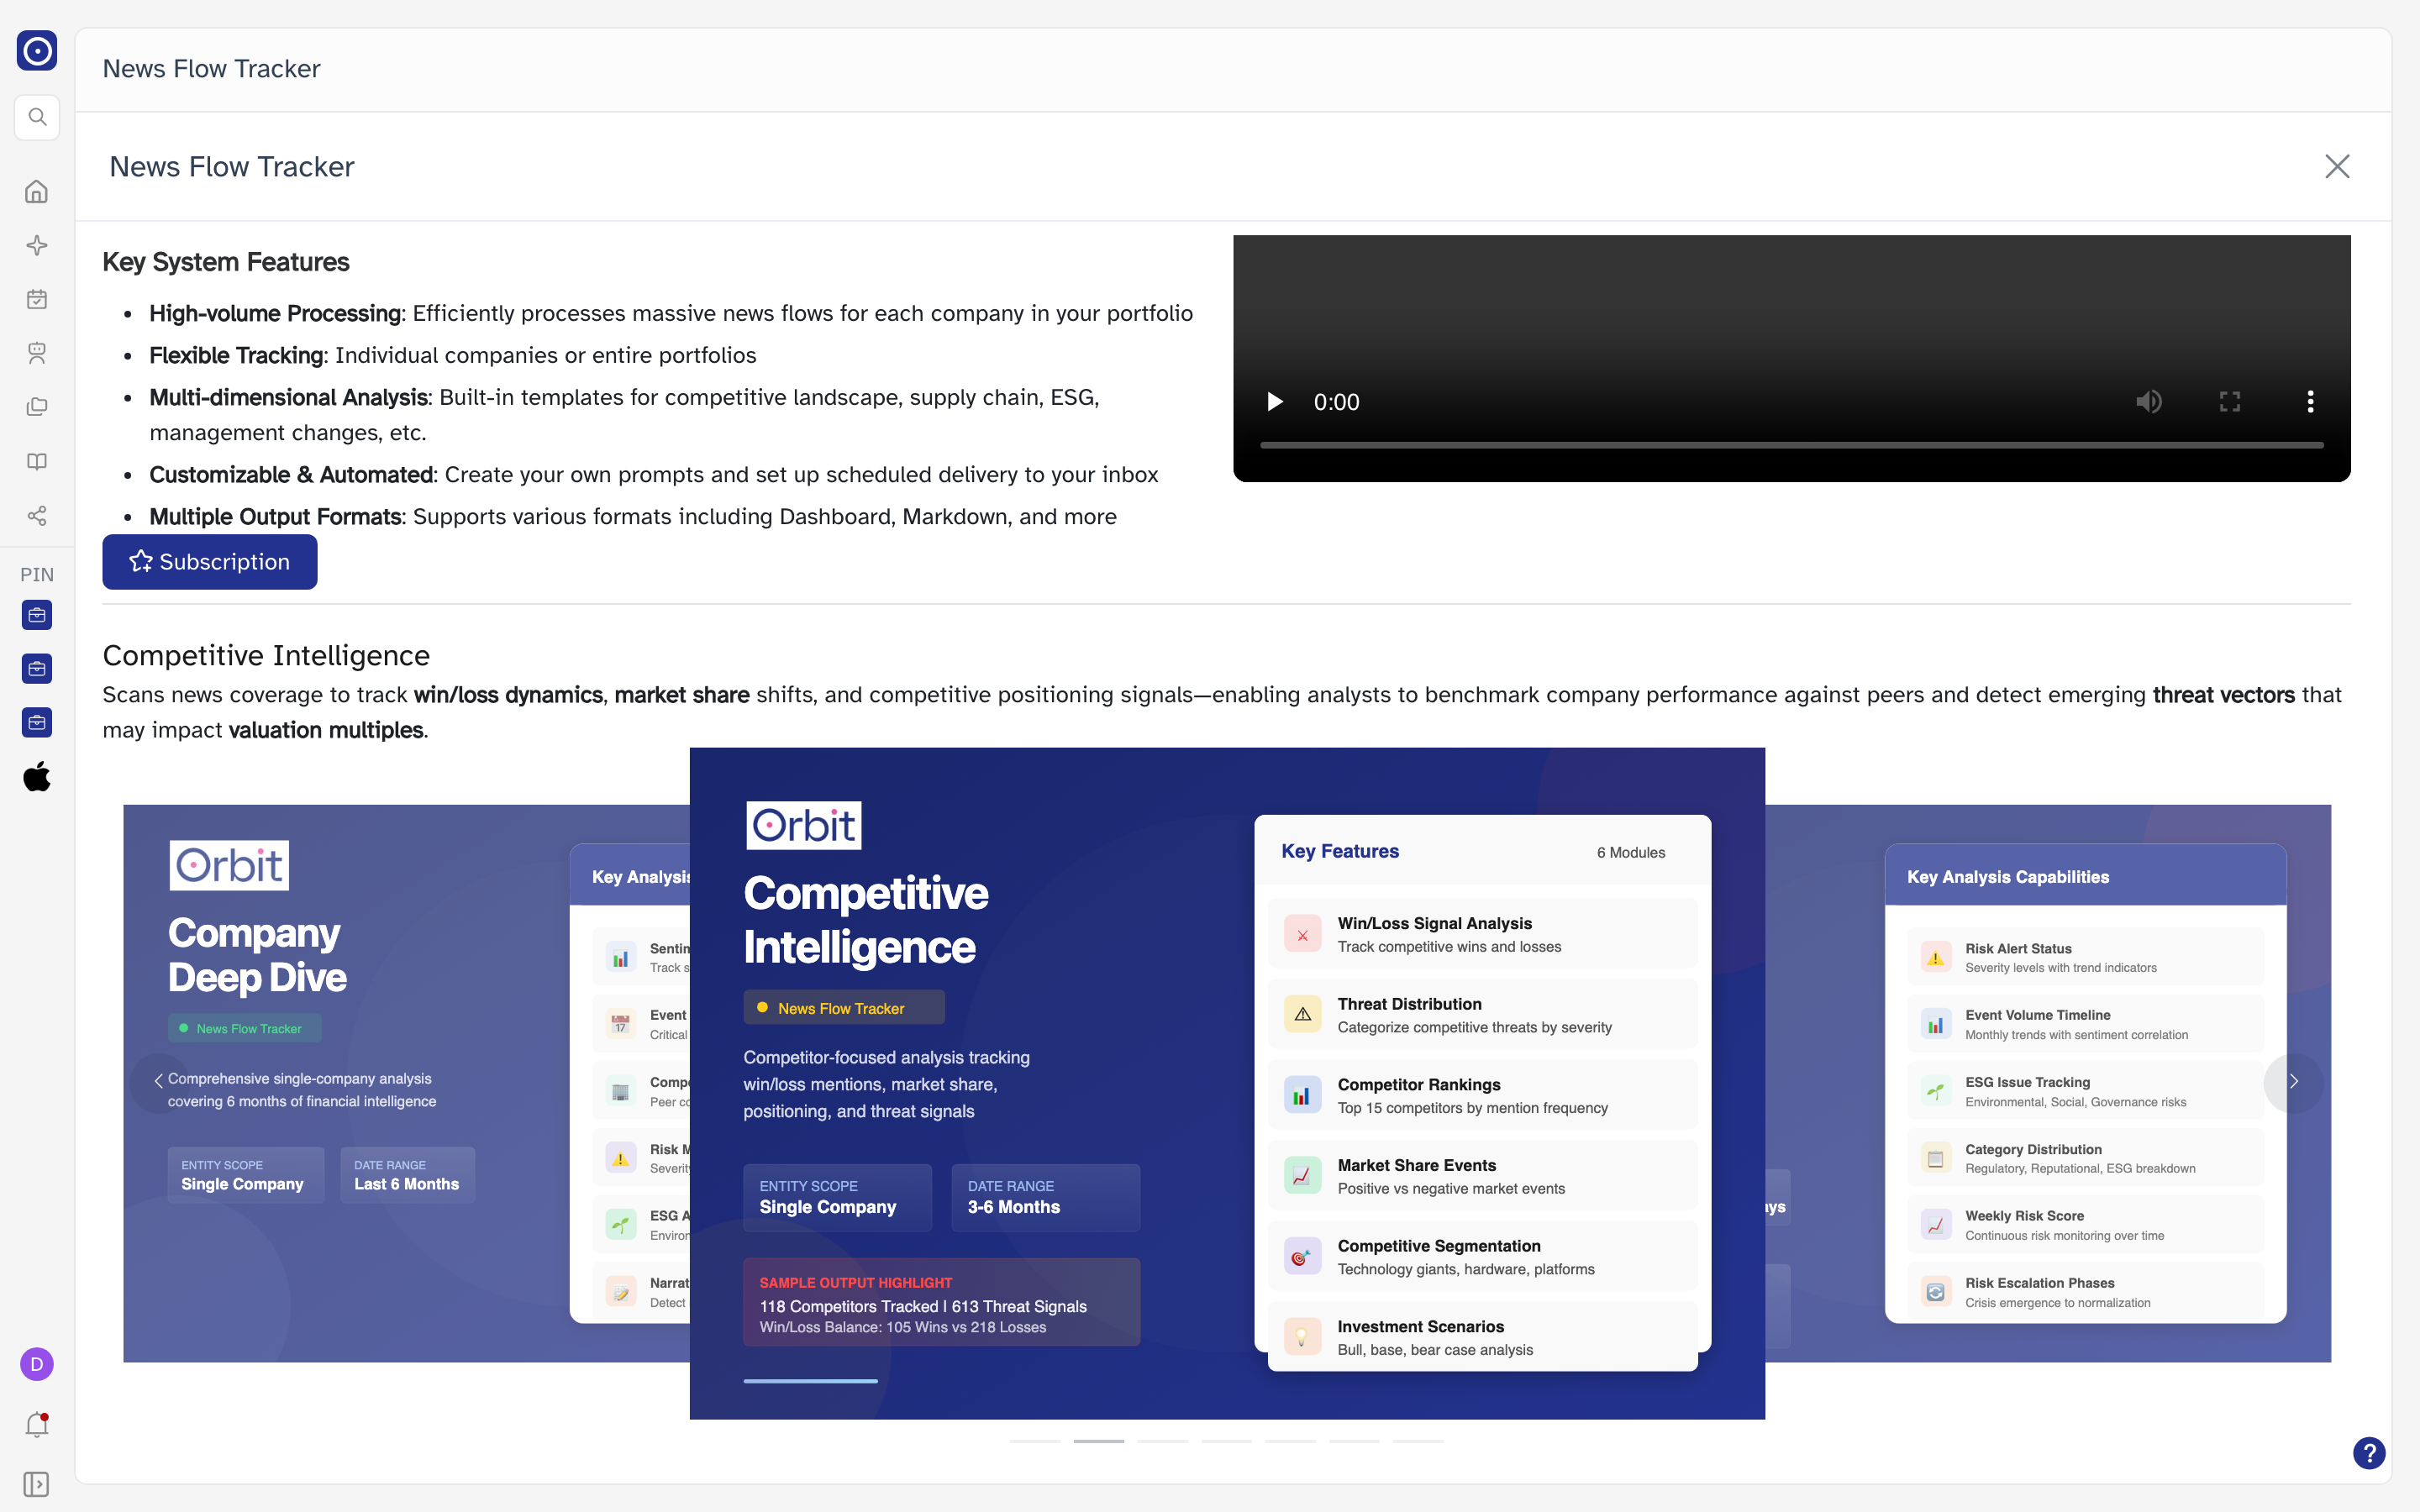
An agent that has never been subscribed shows this same content as the Subscription tab rather than as an overlay — the counters and the table are replaced by the features, the video and the carousel, with the Subscription button ready underneath. Subscribe something and the tab fills in.
Where to go from here
Schedules holds the subscriptions themselves — this page shows the latest result of each, that one shows every schedule and lets you pause or delete it. Share holds the links created from the More menu.
Everything the Detail tab can show depends on the agent having run. If a company you care about is missing from the list, the answer is usually to subscribe it rather than to search for it.