
Theme Discovery
Orbit reads the news behind your universe every week, sorts what it finds into named themes, and scores how strongly each one is running. This page is where you read the result: one report per week, plus a monthly report that consolidates them.
Opening the page
- Open the Dashboard.
- Find the Emerging Theme Detector panel.
- Click the panel's heading to open the newest report, or click a report title inside the panel to open that particular one.
There is no entry for this page in the left rail — the Dashboard panel is the way in. Opening from a report title carries that report through, so you land on the one you clicked rather than on the newest.
The page at a glance
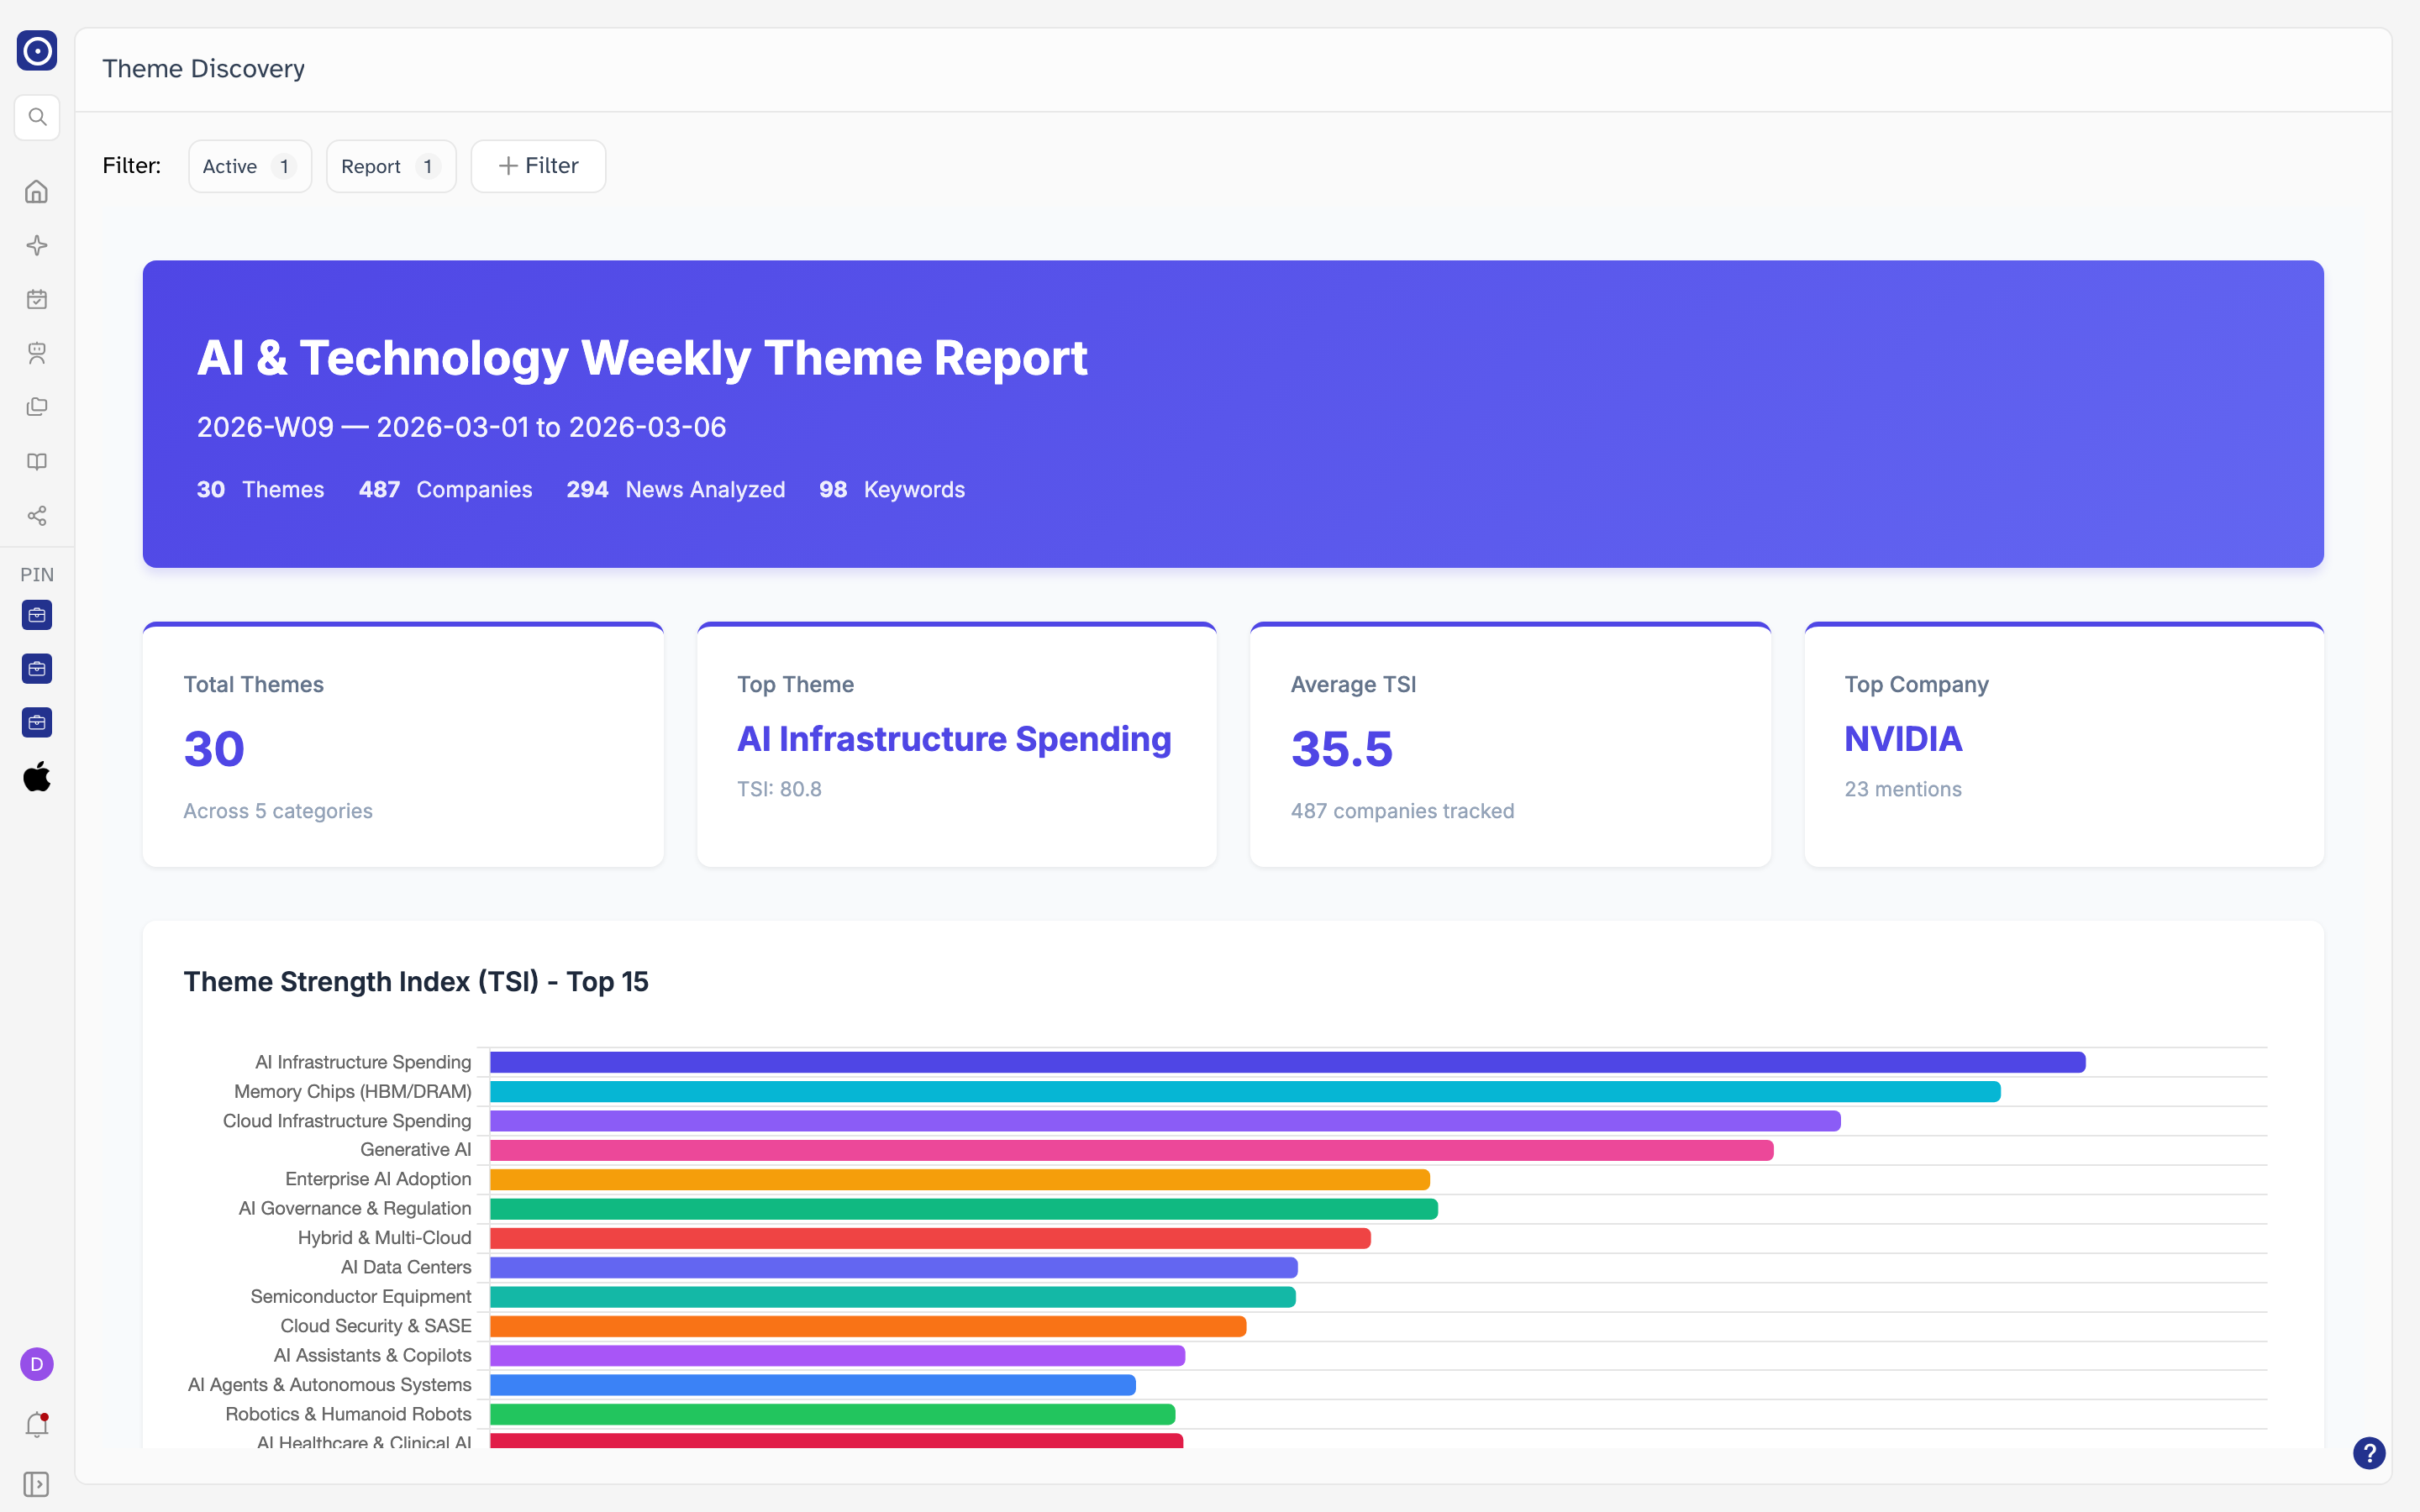
A filter line sits at the top and everything below it is the report. The report is a finished document Orbit generates for the period — you scroll it like any long page, and nothing on it is editable.
Choosing a report
Every report belongs to a type — Weekly or Monthly — and to a period. The line at the top is how you move between them. It holds two filters, and the number beside each is how many values it is set to.
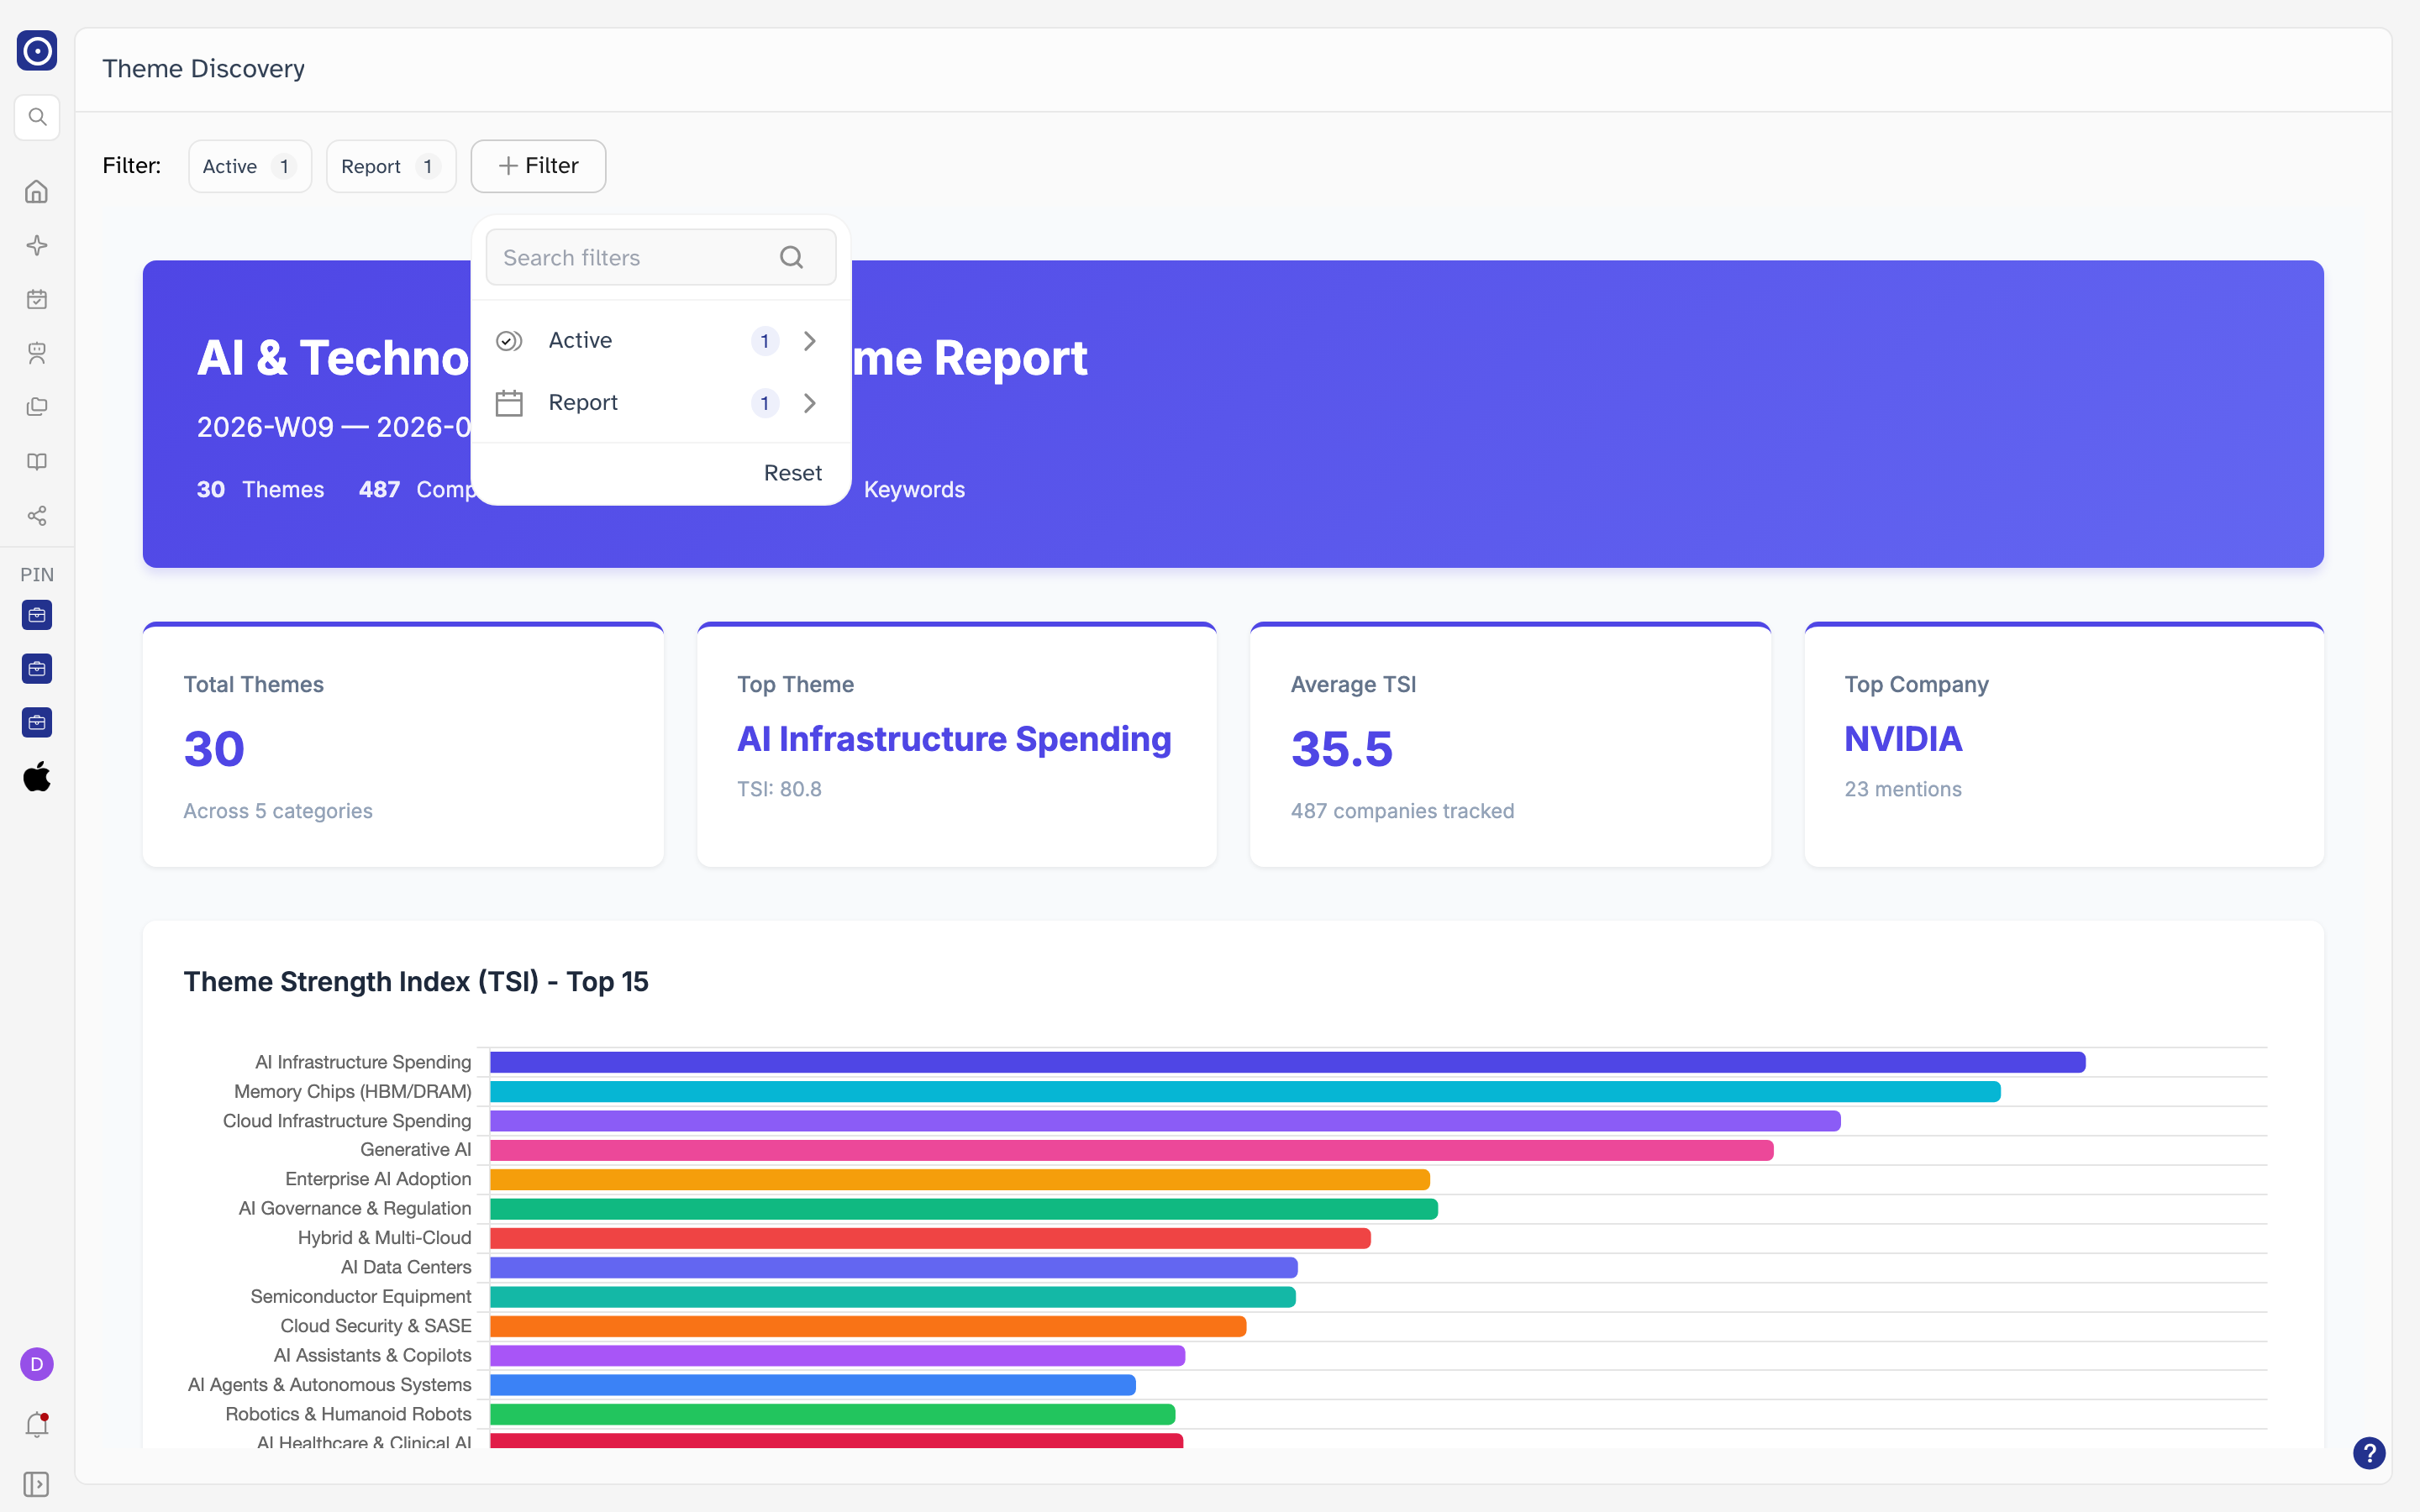
| Filter | What it holds |
|---|---|
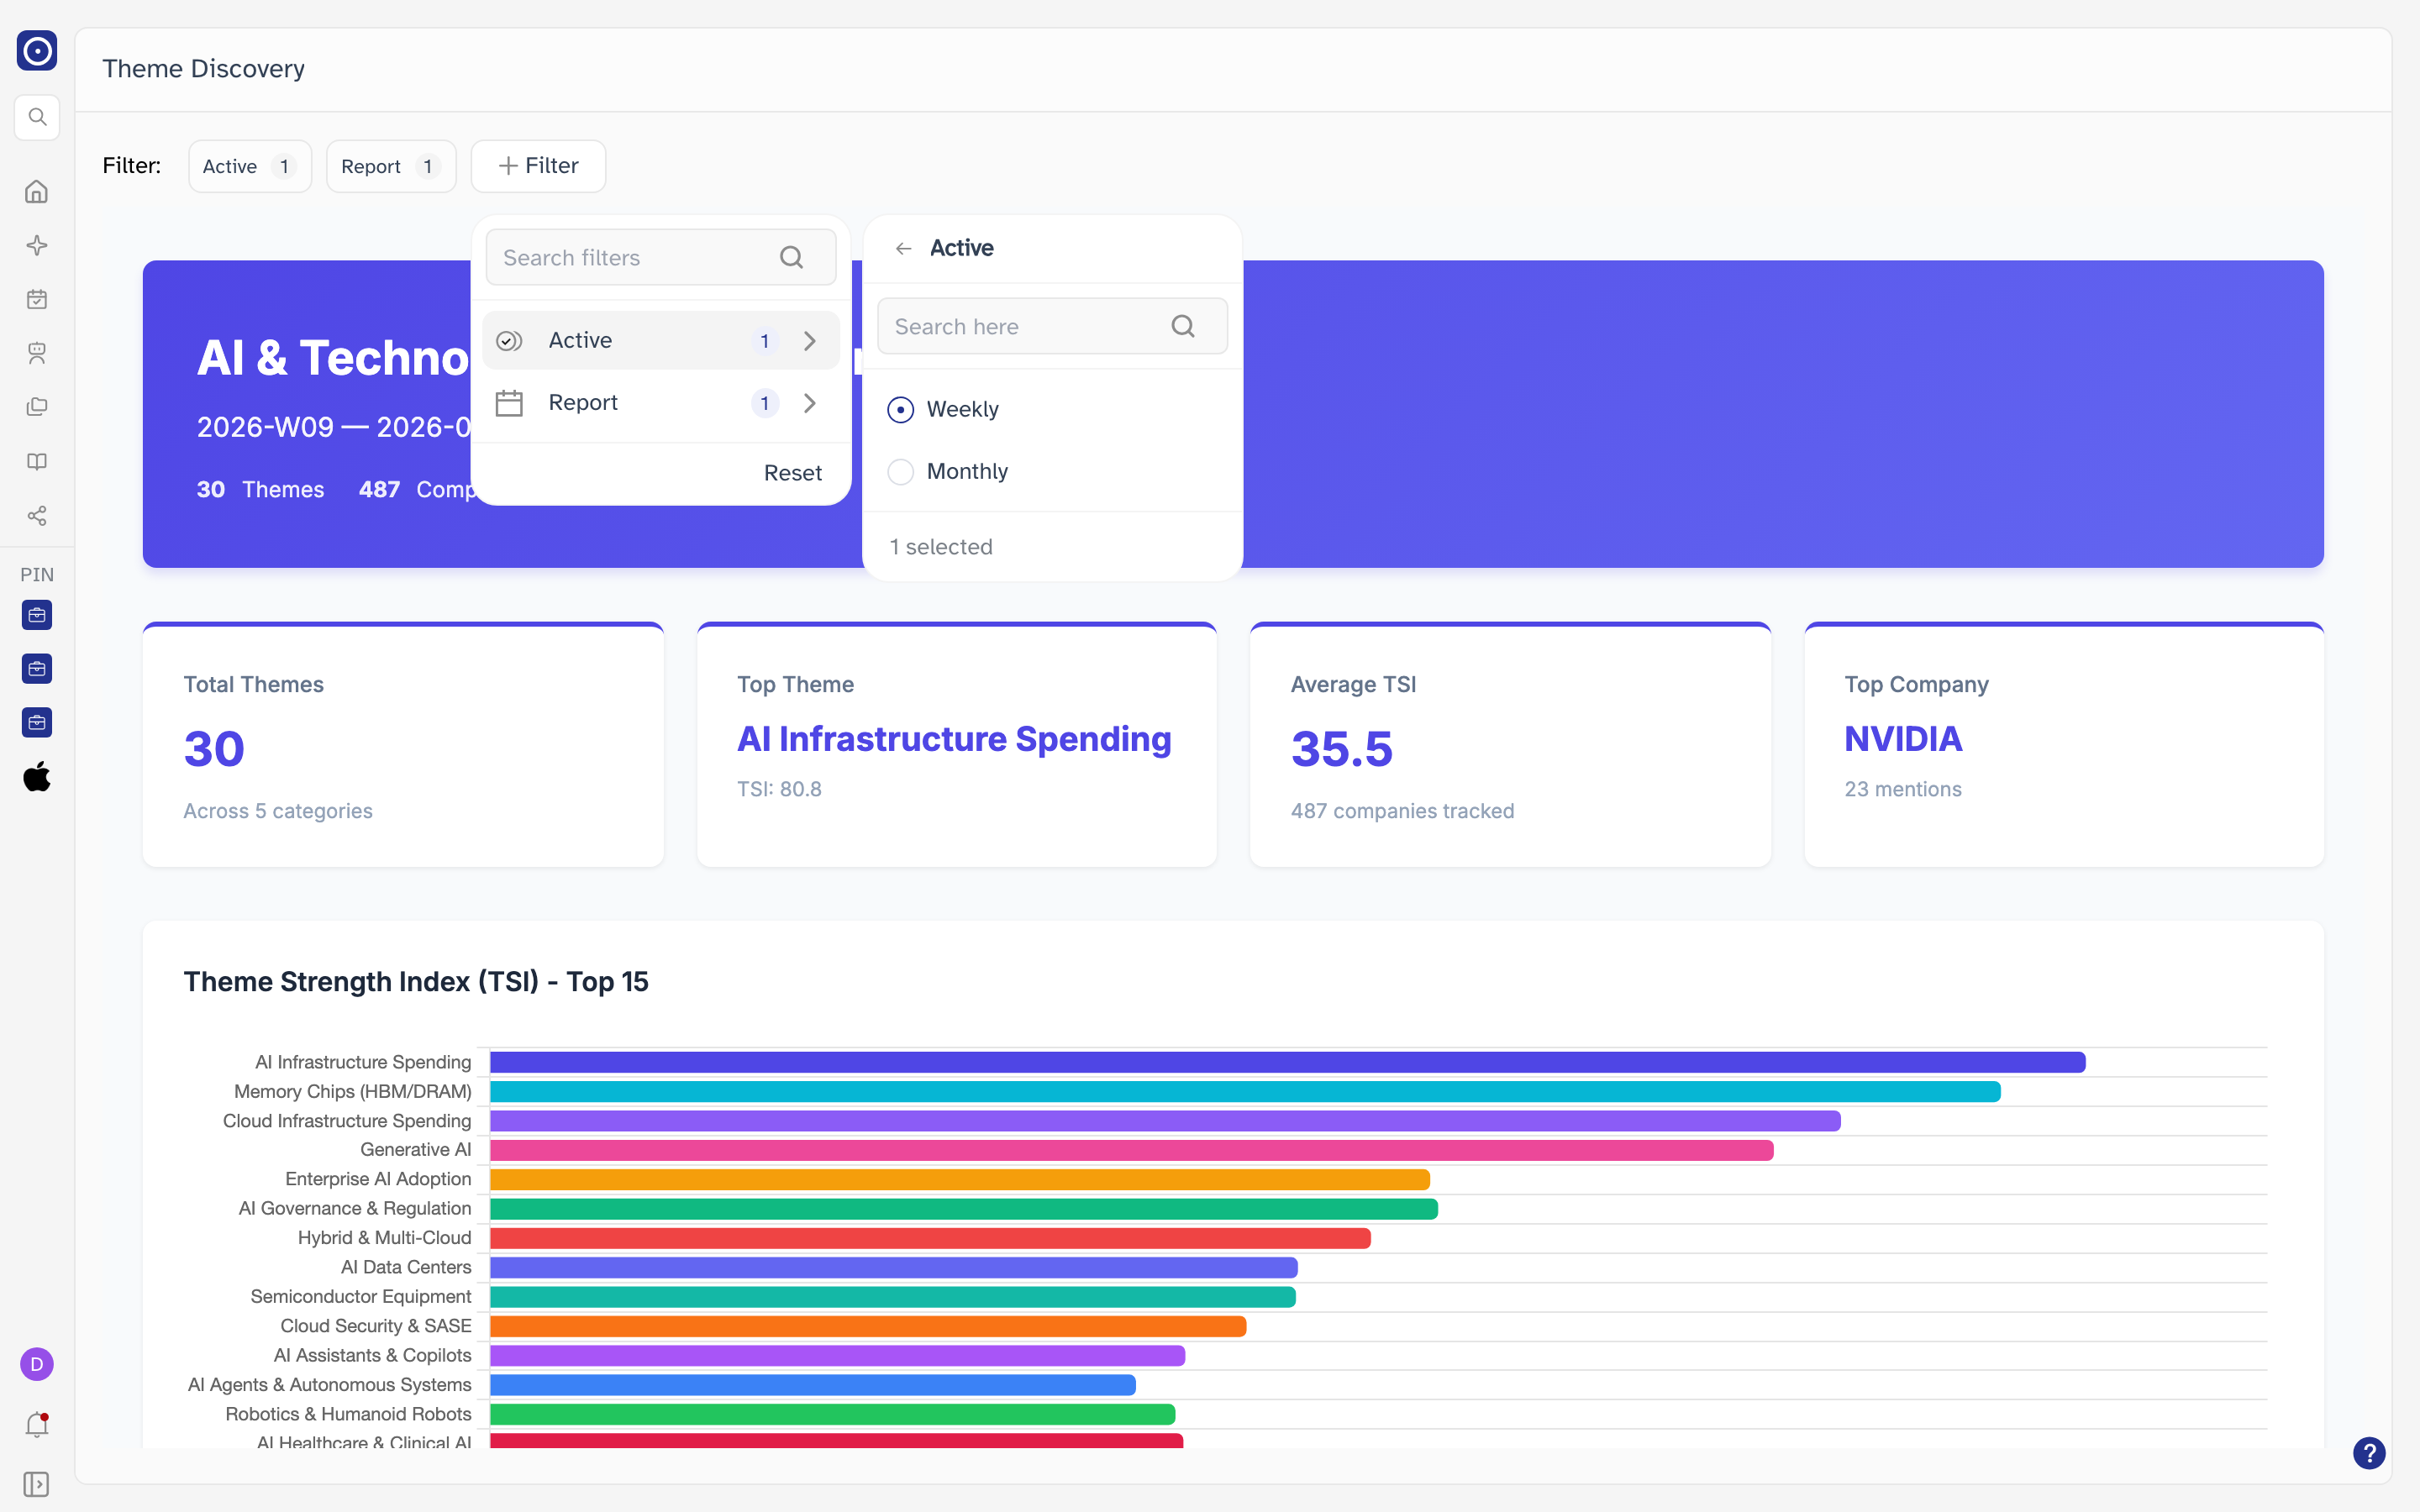
| Active | Whether you are reading a weekly or a monthly report. |
| Report | Which published report of that type. Weekly reports are labelled with the dates they cover; monthly ones with the month. |
Active
Report
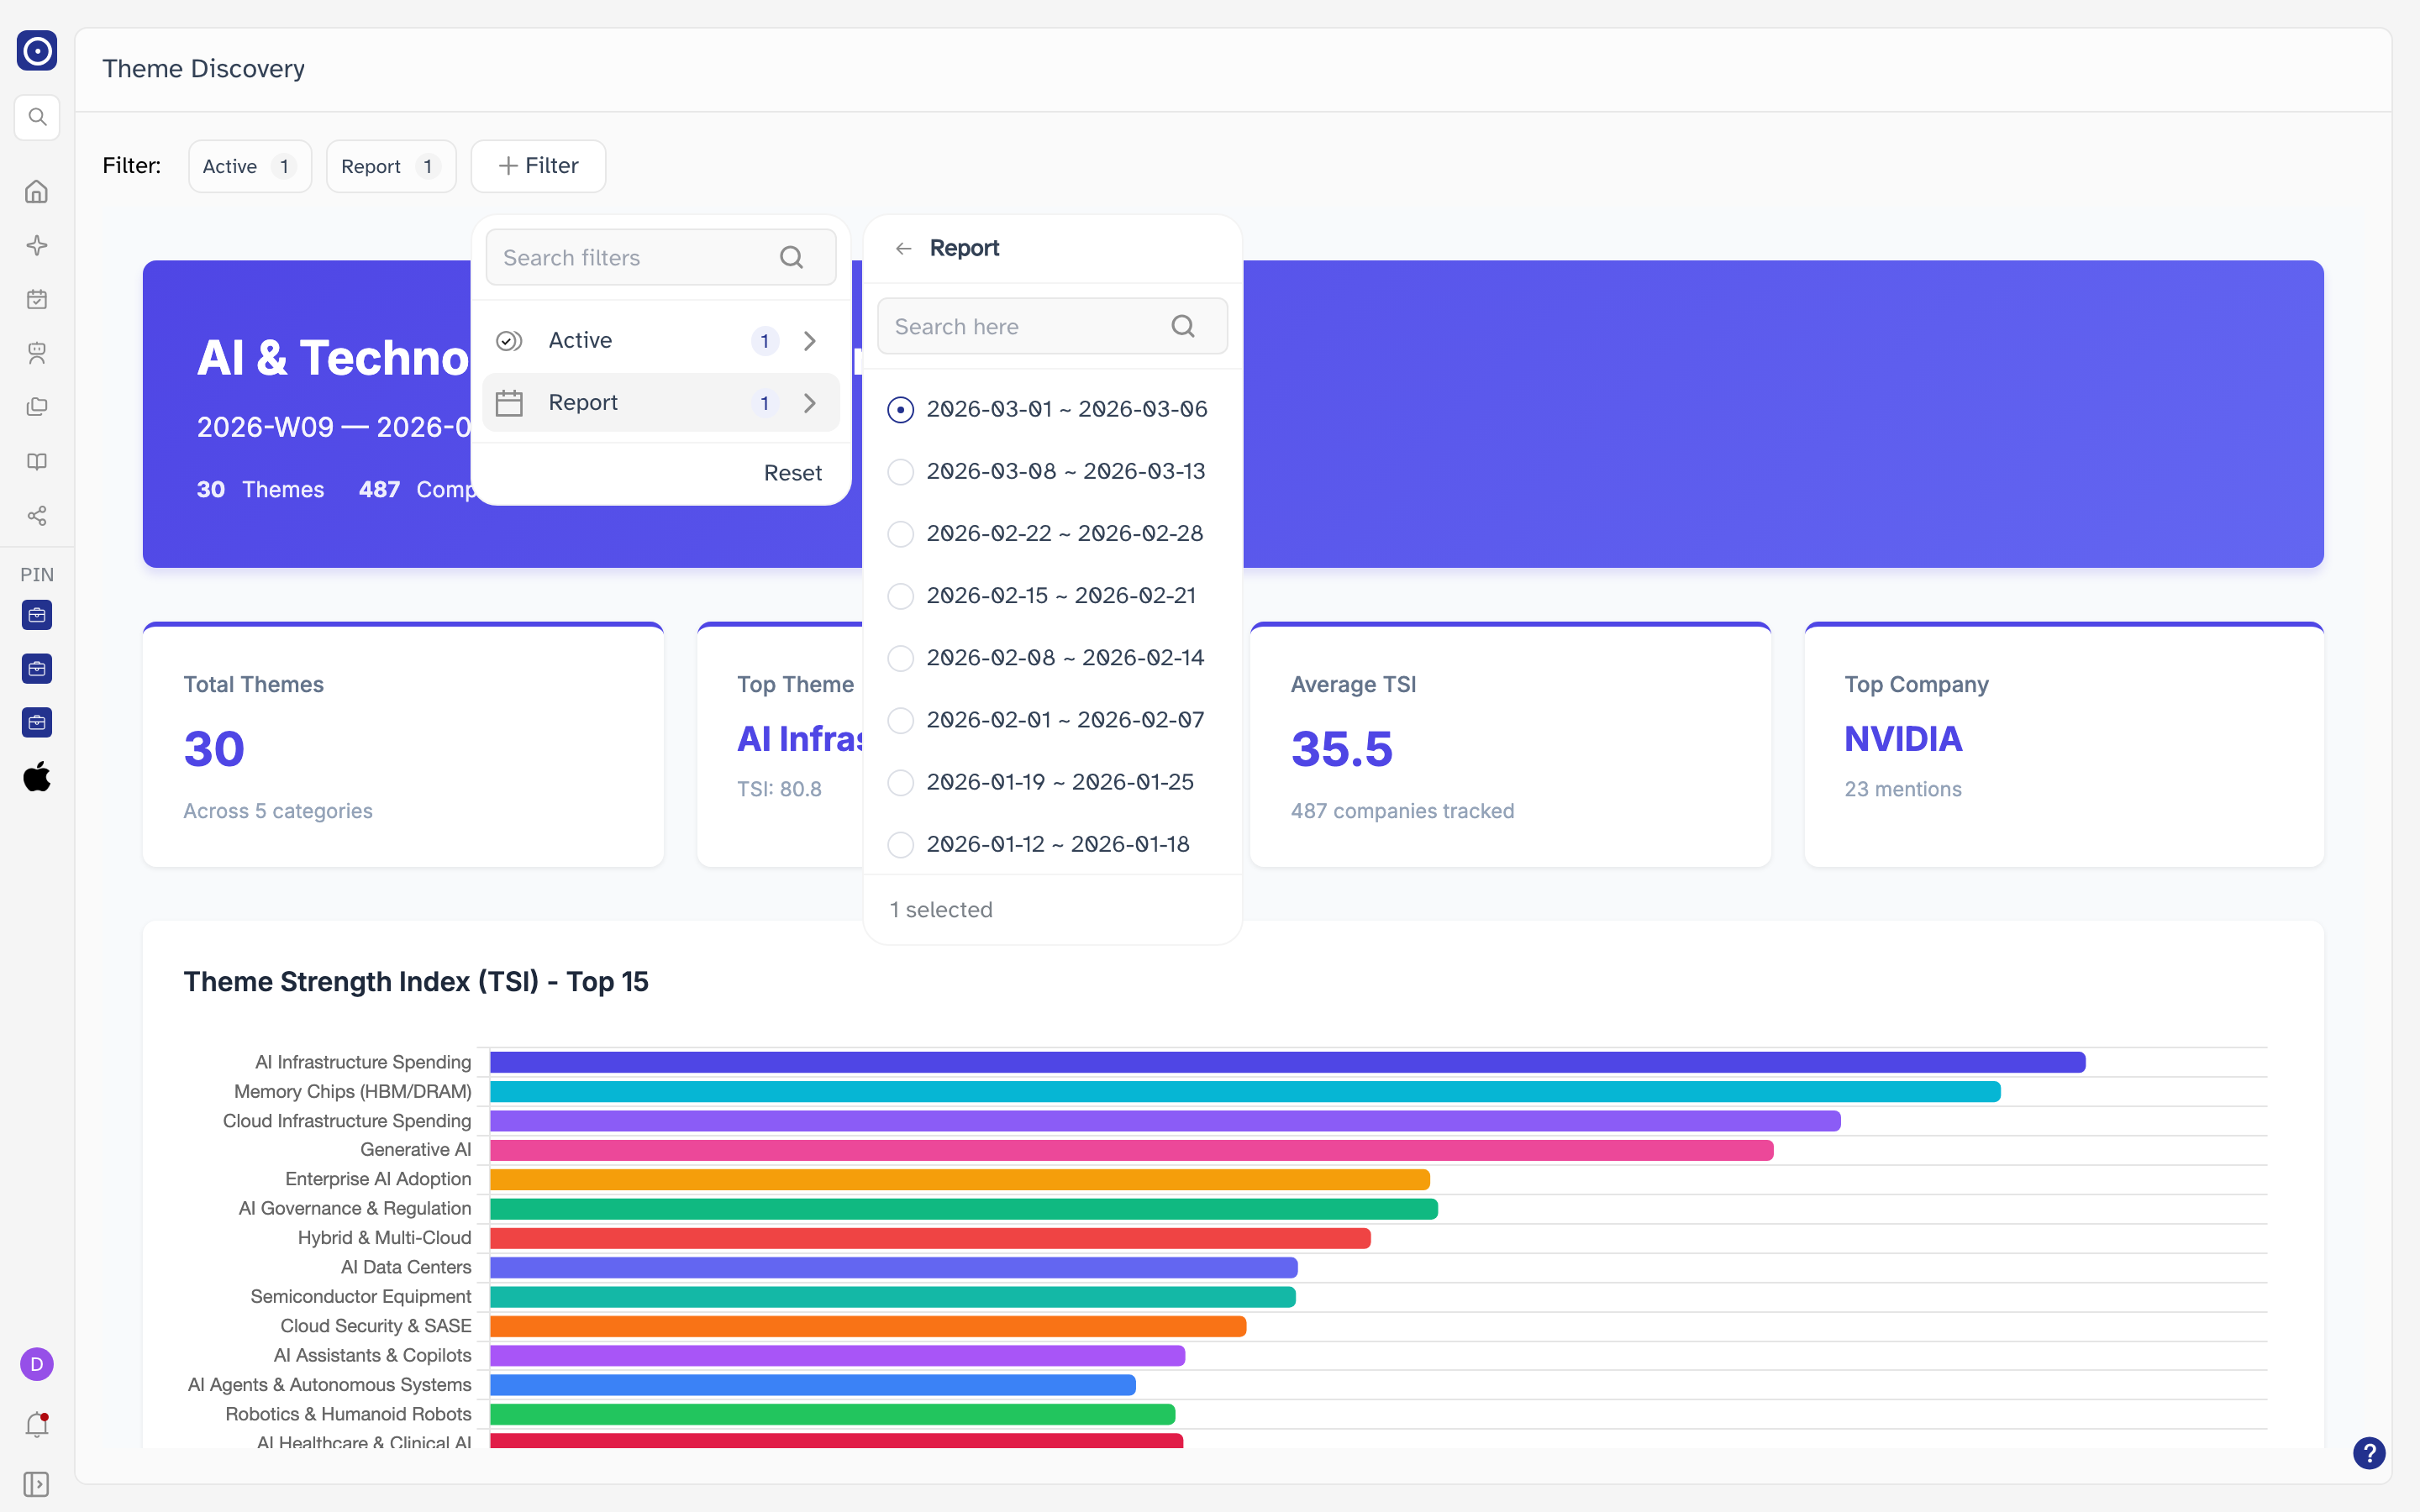
Both filters always hold exactly one value, so you cannot list every report at once. That also leaves Reset with nothing to clear — clicking it leaves the report you are reading on screen.
Weekly and monthly reports
The two types are not the same report at different lengths. A weekly report looks at one week on its own; the monthly report reconciles several weekly runs and keeps what held up.
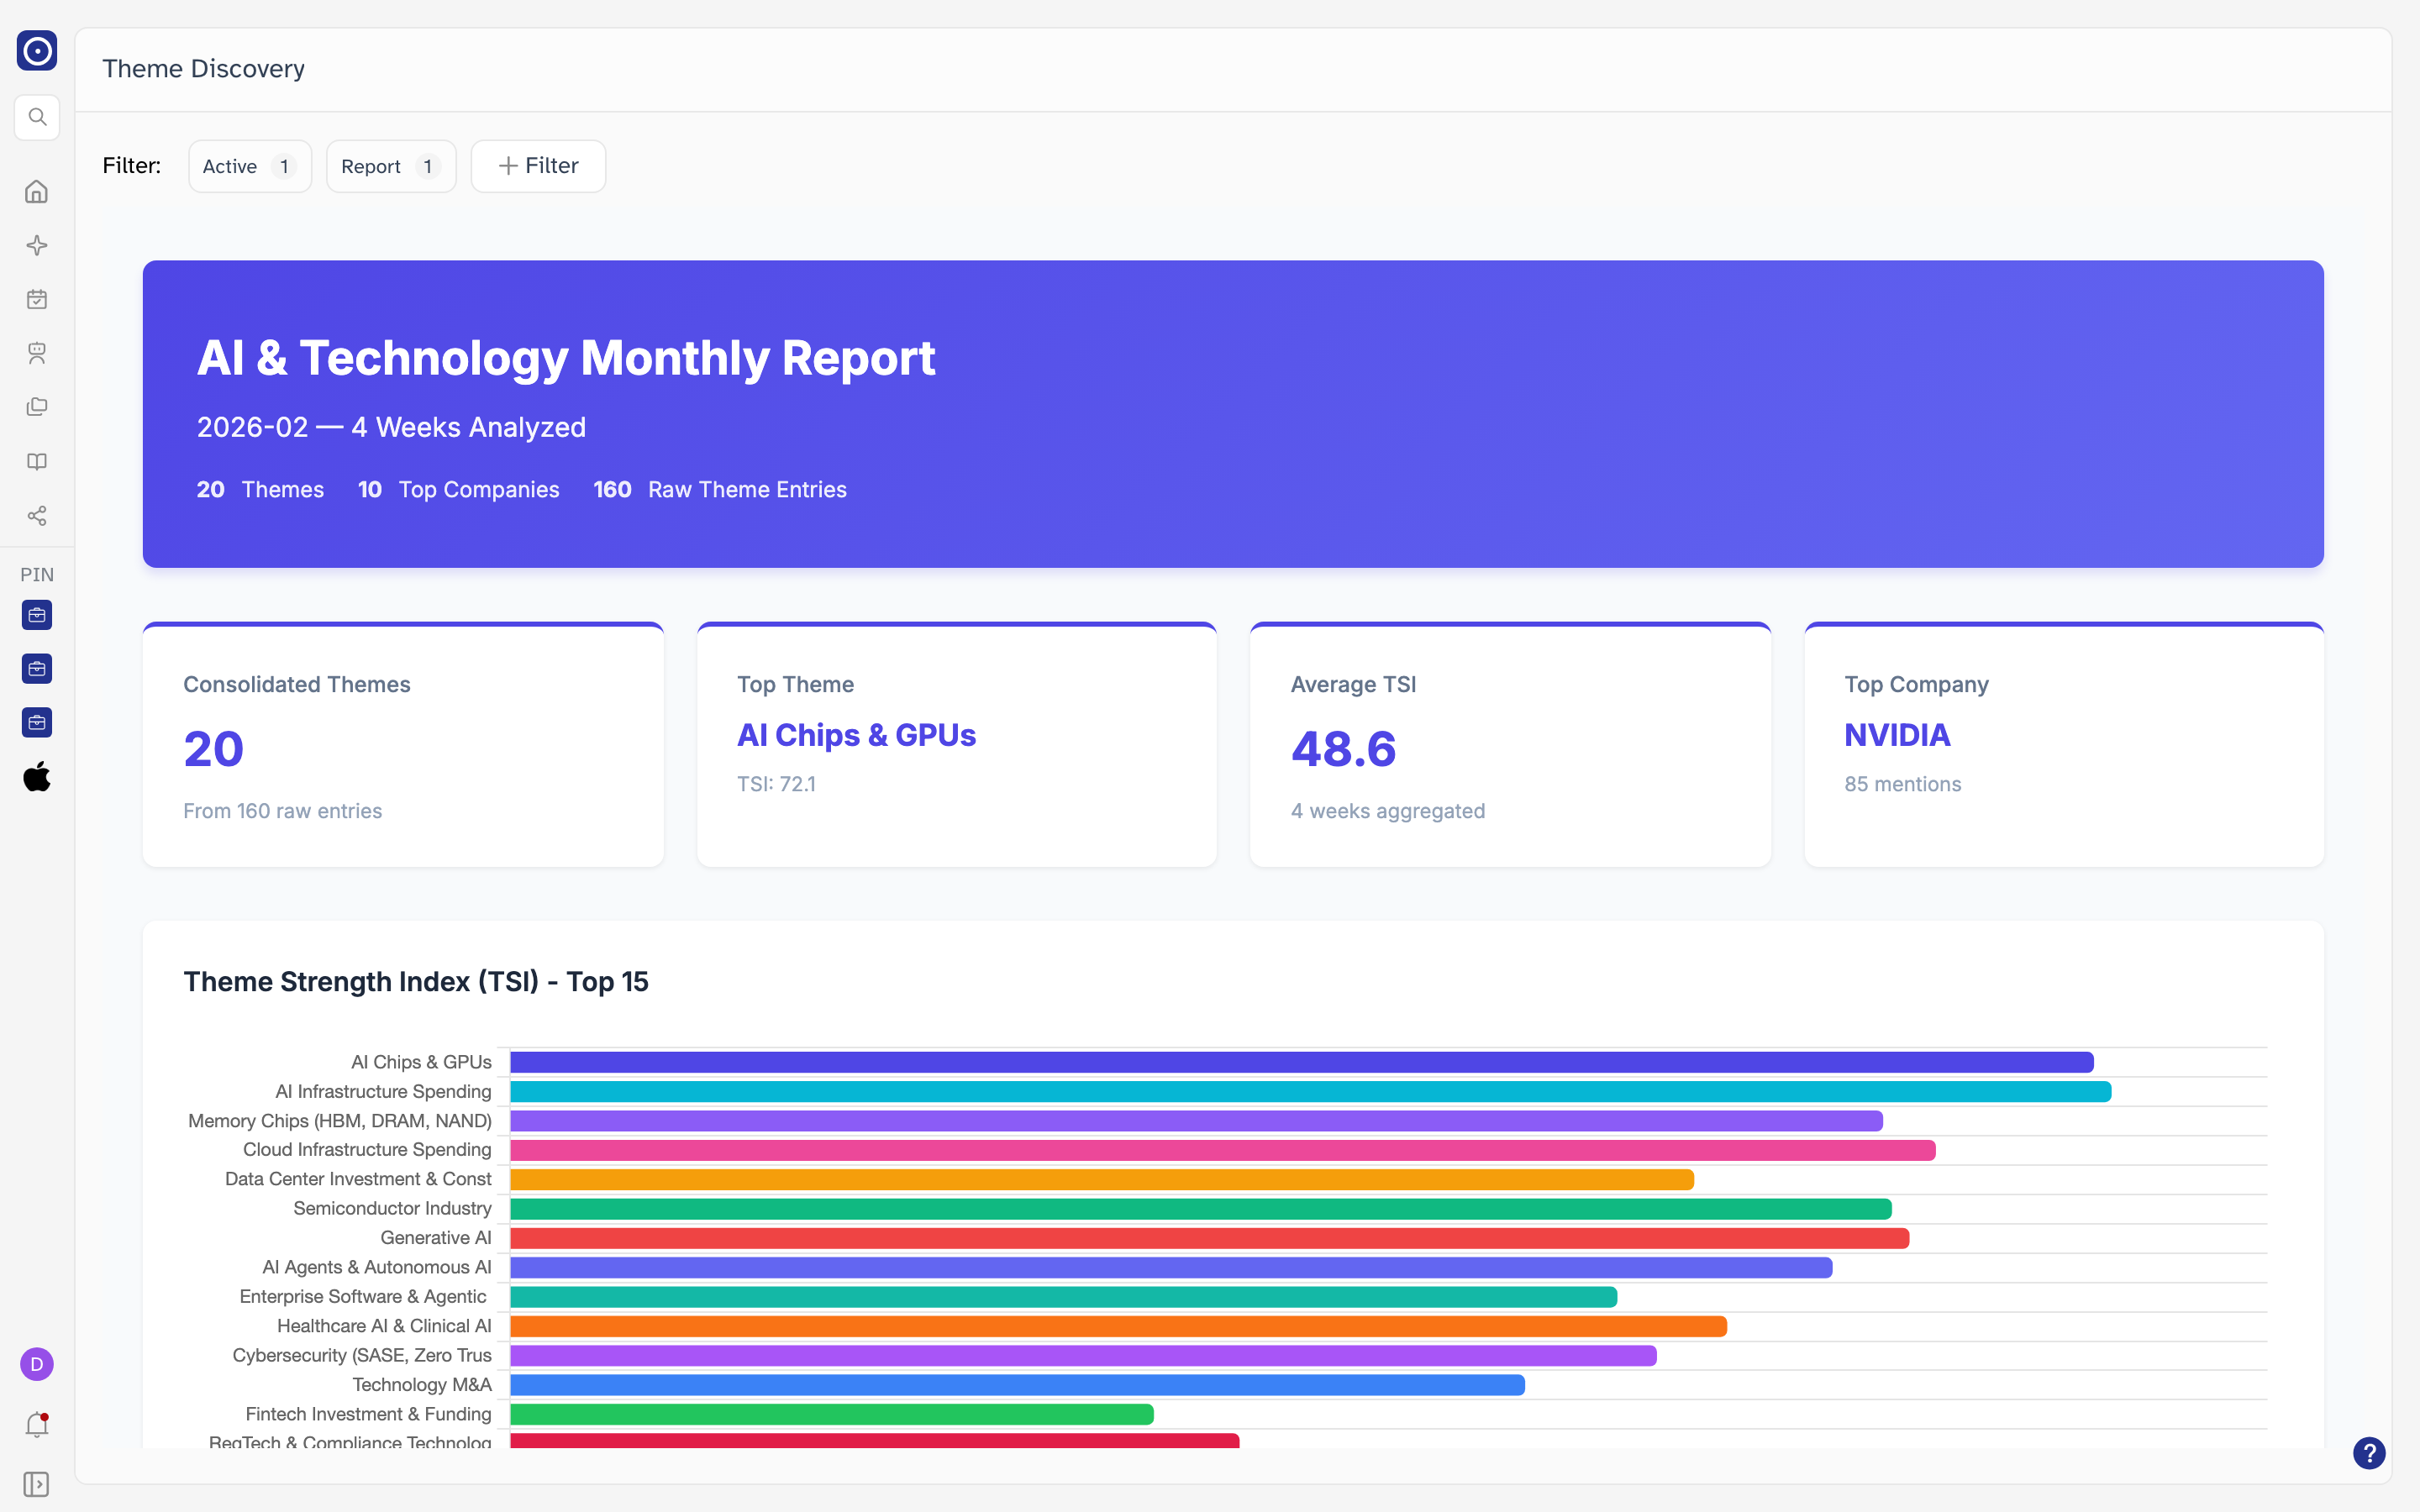
| On the header | Weekly | Monthly |
|---|---|---|
| Period | The number of the week and its dates — for example 2026-W09 — 2026-03-01 to 2026-03-06. |
The month and how many weeks went into it — for example 2026-02 — 4 Weeks Analyzed. |
| Counters | Themes, Companies, News Analyzed, Keywords. | Themes, Top Companies, Raw Theme Entries. |
The headline figures
Four cards sit between the header and the charts. They are the quickest way to decide whether a period is worth reading in full.
| Card | What it reports |
|---|---|
| Total Themes | How many themes the period produced, and the line underneath counts the categories they fall into. A monthly report labels this card Consolidated Themes and counts the raw entries it was built from instead. |
| Top Theme | The highest-scoring theme of the period, with its TSI. It is a label, not a link. |
| Average TSI | The average score across the themes. The line underneath says how many companies the period tracked, or how many weeks were aggregated. |
| Top Company | The company mentioned most often, and the number of mentions behind it. |
Theme Strength Index
Every theme is given a Theme Strength Index — TSI — for the period. The chart below the cards ranks the strongest of them, longest bar first, so the order on screen is the order of the score.
The chart stops at fifteen themes even when the period produced more, so a week with thirty themes charts half of them. Read the top of the chart as where attention is concentrated rather than as the whole period.
Below the charts
Scrolling past the TSI chart brings you to the rest of the report.
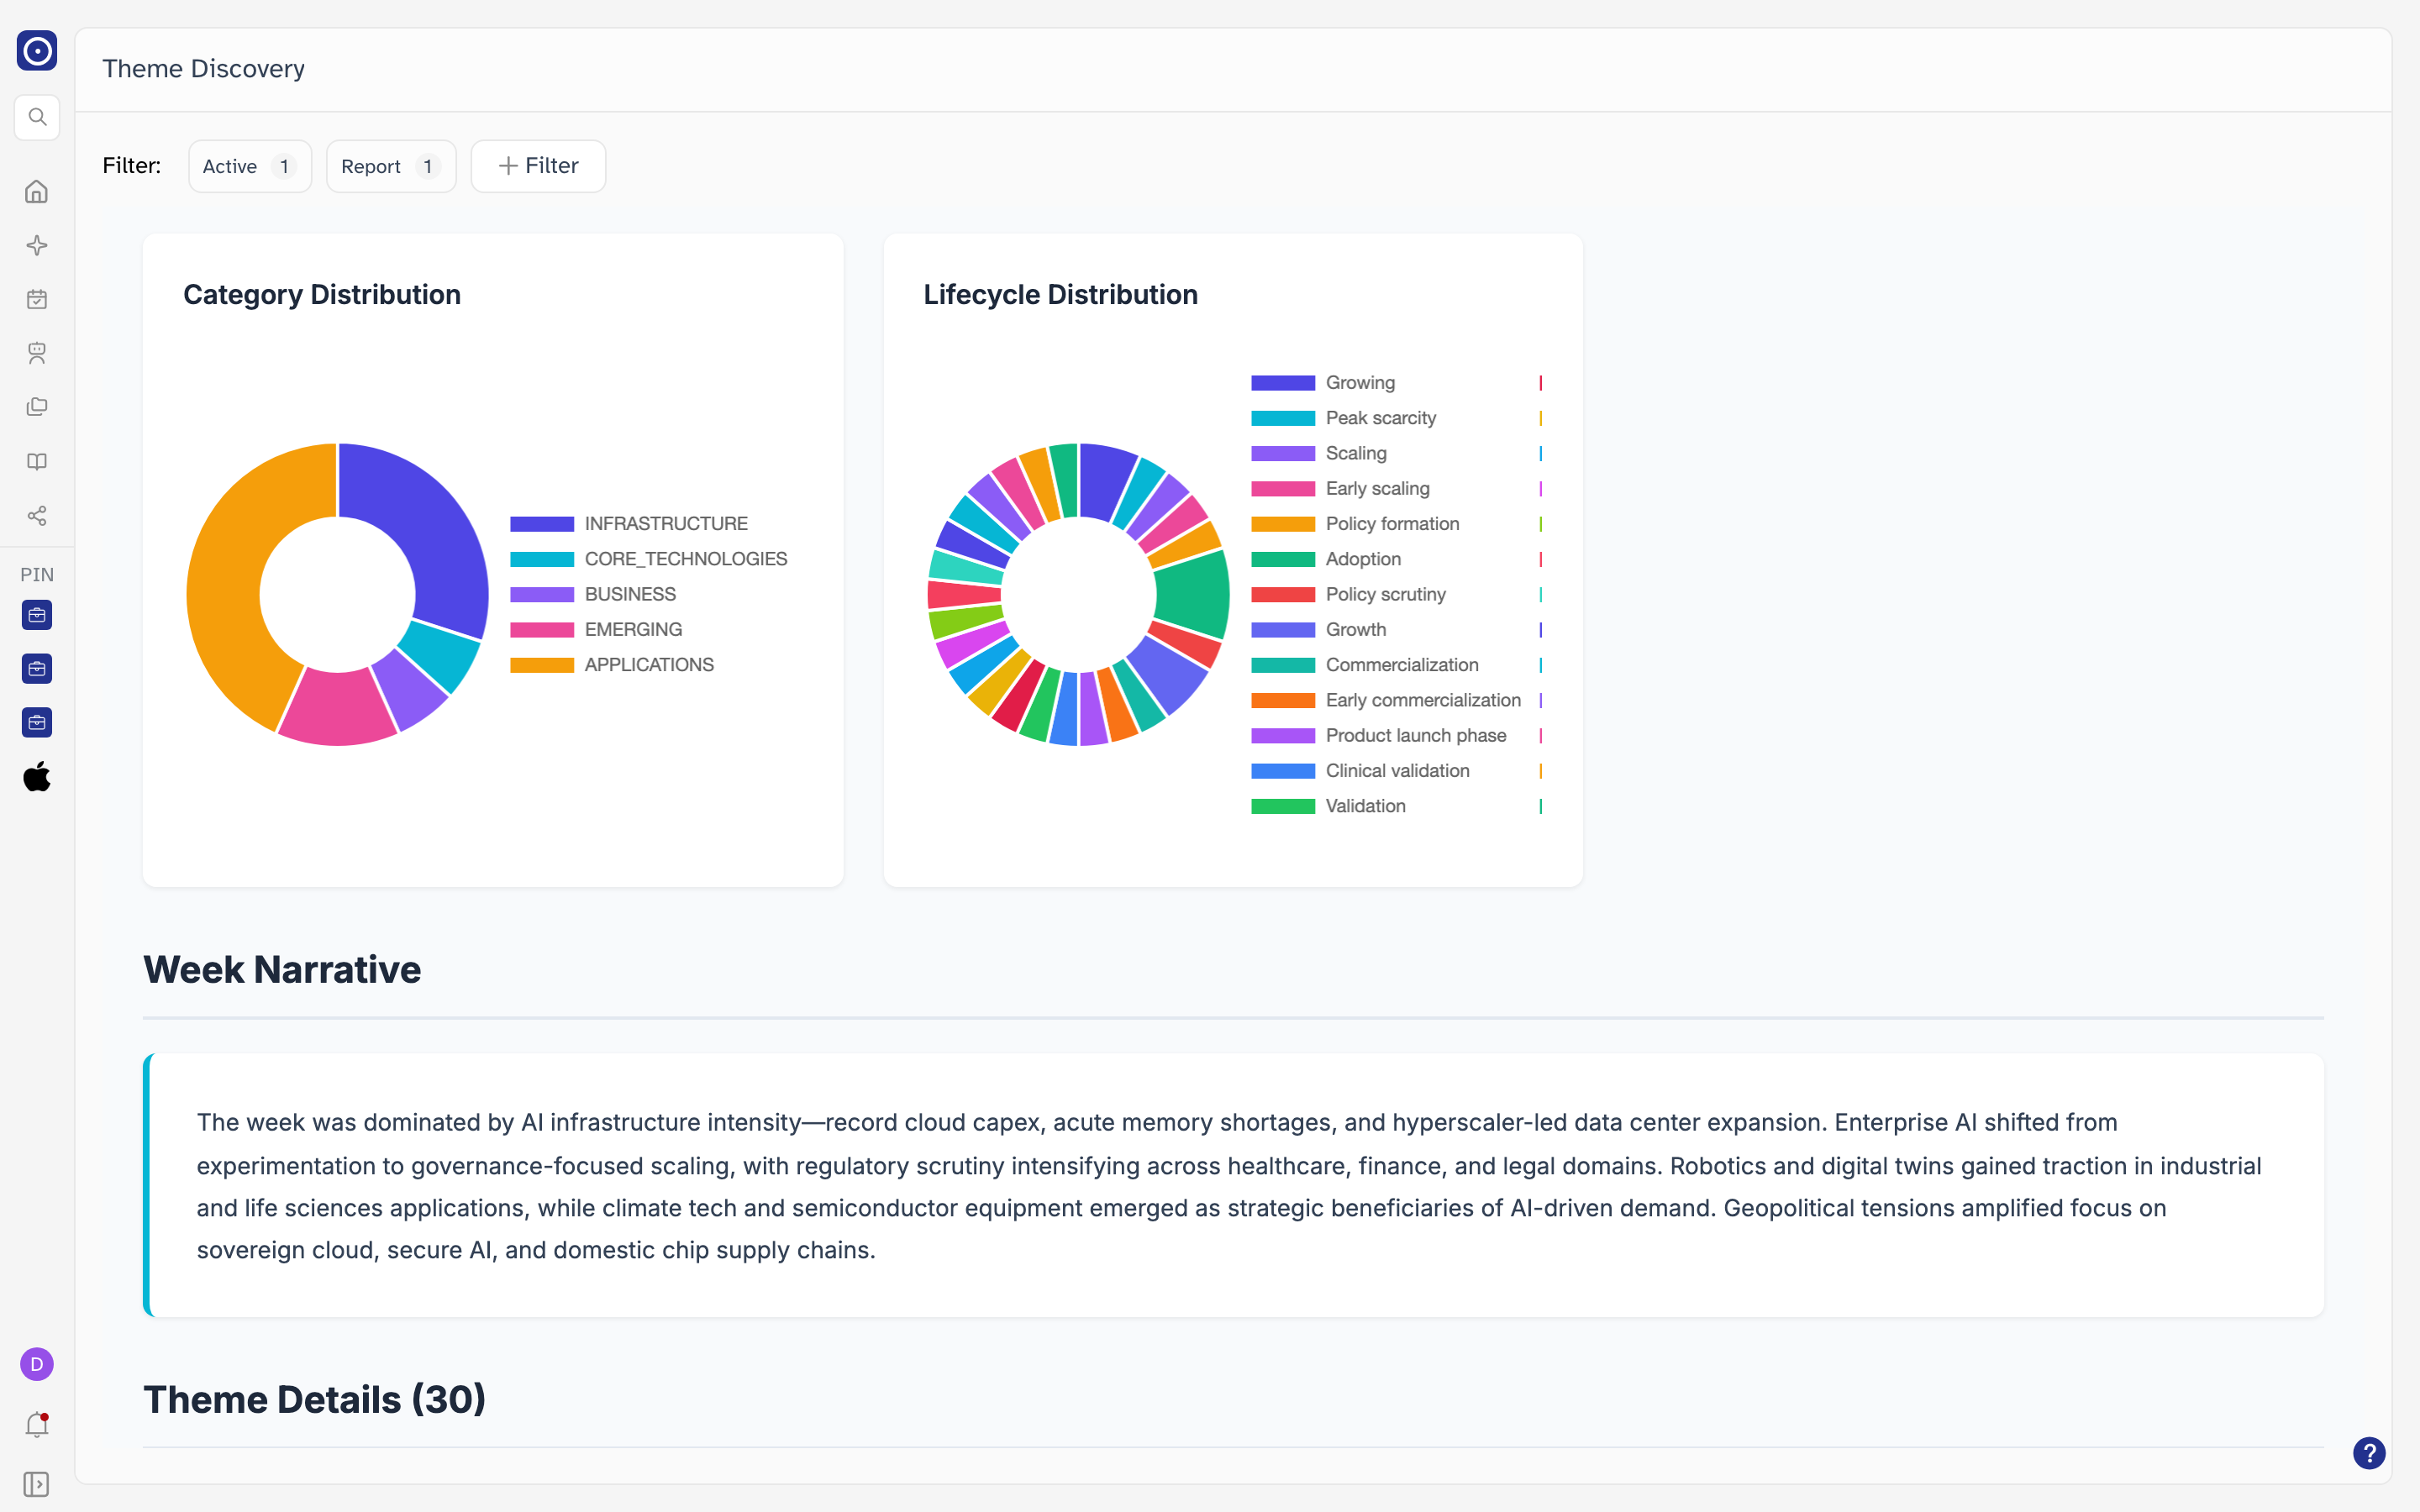
Week Narrative is the period described in a short paragraph — the same picture the charts draw, in prose. A monthly report calls it Month Narrative.
Theme Details
The last and longest section works through every theme one at a time. The number in the heading is how many the period produced, and they are listed in rank order.
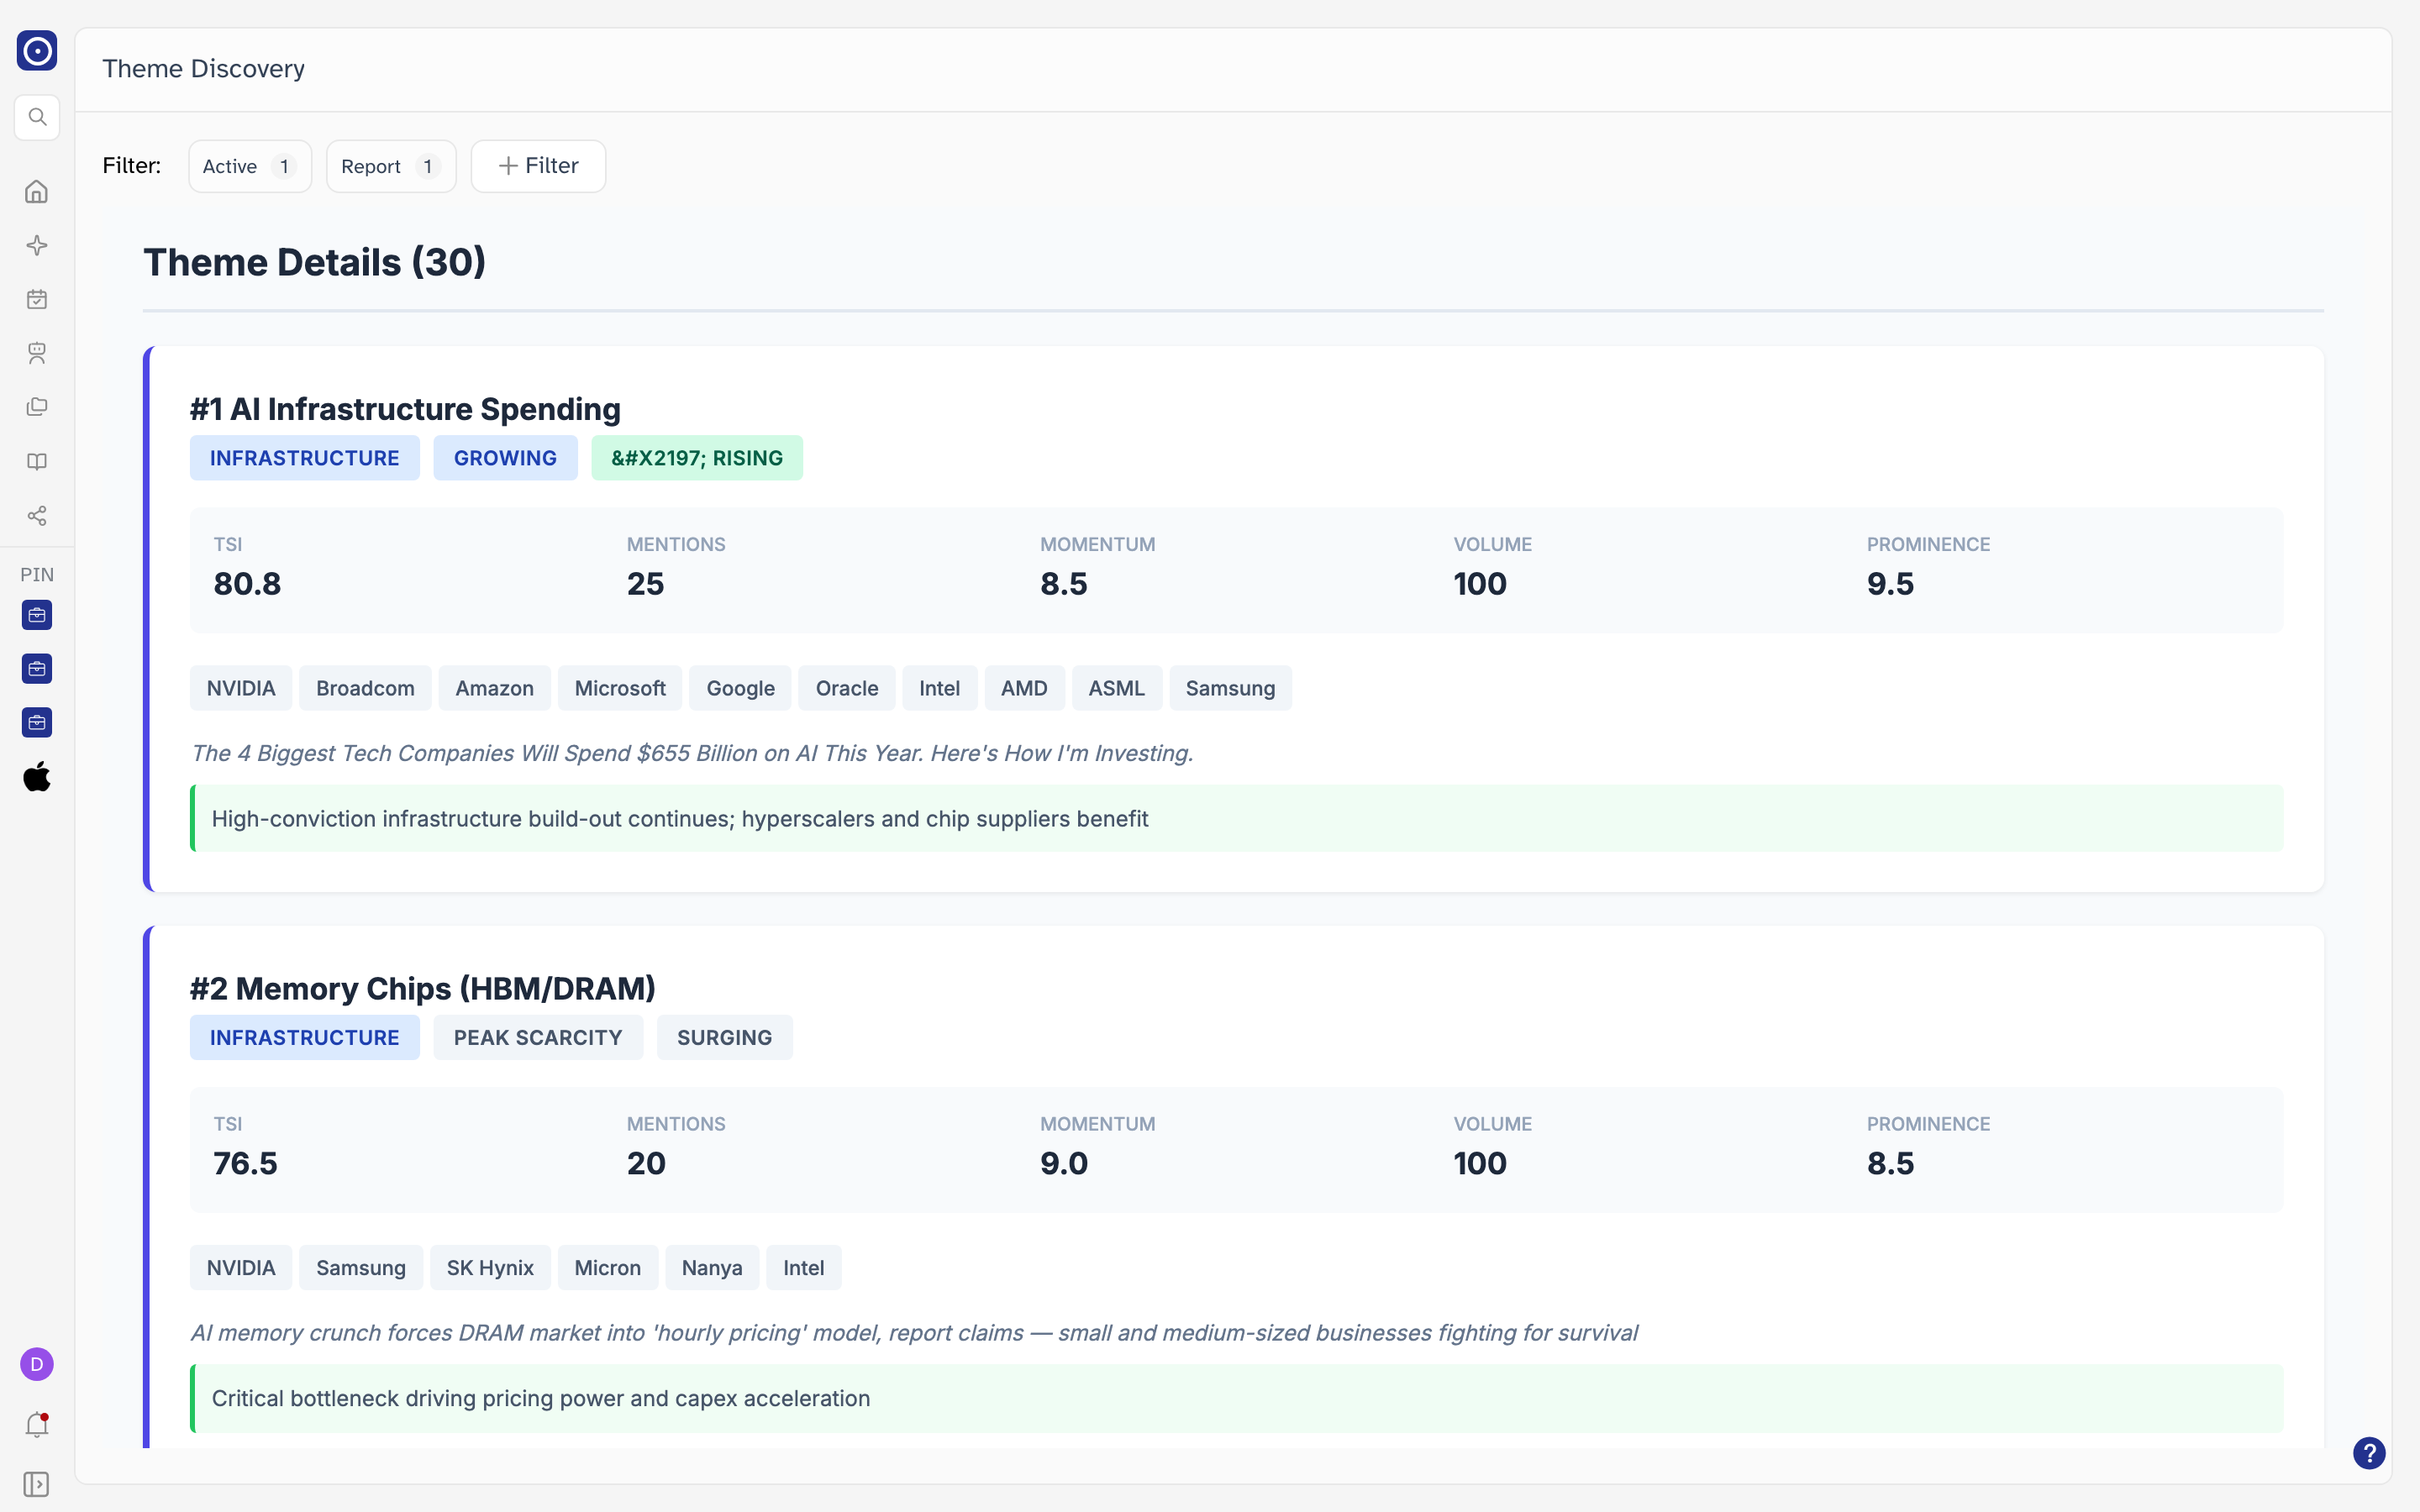
| On a theme card | What it shows |
|---|---|
| #1 | The theme's rank for the period. The list runs from #1 downwards. |
| Category badge | The sector the theme belongs to, for example INFRASTRUCTURE. It matches a slice of Category Distribution. |
| Lifecycle badge | How mature the theme is, for example GROWING. It matches a slice of Lifecycle Distribution. |
| Momentum badge | Which way the theme is moving, with an arrow. |
| TSI | The theme's score for the period. The same figure drives its place in the chart. |
| Mentions | How many times the theme came up. |
| Momentum | A second momentum figure, alongside the badge. |
| Volume | How much material stood behind the theme. |
| Prominence | How prominently it featured. |
| Company tags | The companies most associated with the theme. They are labels — click one and nothing opens. |
| Headline | The news item the theme was drawn from, in italics. Some cards show a source name instead when no single headline represents the theme. |
| Green strip | One line saying what the theme means for the period. |
A report is a snapshot of the period it covers and does not change afterwards. The footer of each one records when Orbit generated it, which is usually a few days after the period ends.
What to do next
A theme you want to keep an eye on is usually worth following through the companies behind it — the tags on the card name them, and Portfolio Management is where you turn a list of them into something Orbit reports on every day.