
Dashboard widgets
Everything you can put on a dashboard, and what each one shows. Orbit builds thirteen widgets itself, and the gallery adds one more for every agent you have built — so the catalogue is in two parts: the fixed set, and your own.
The three categories
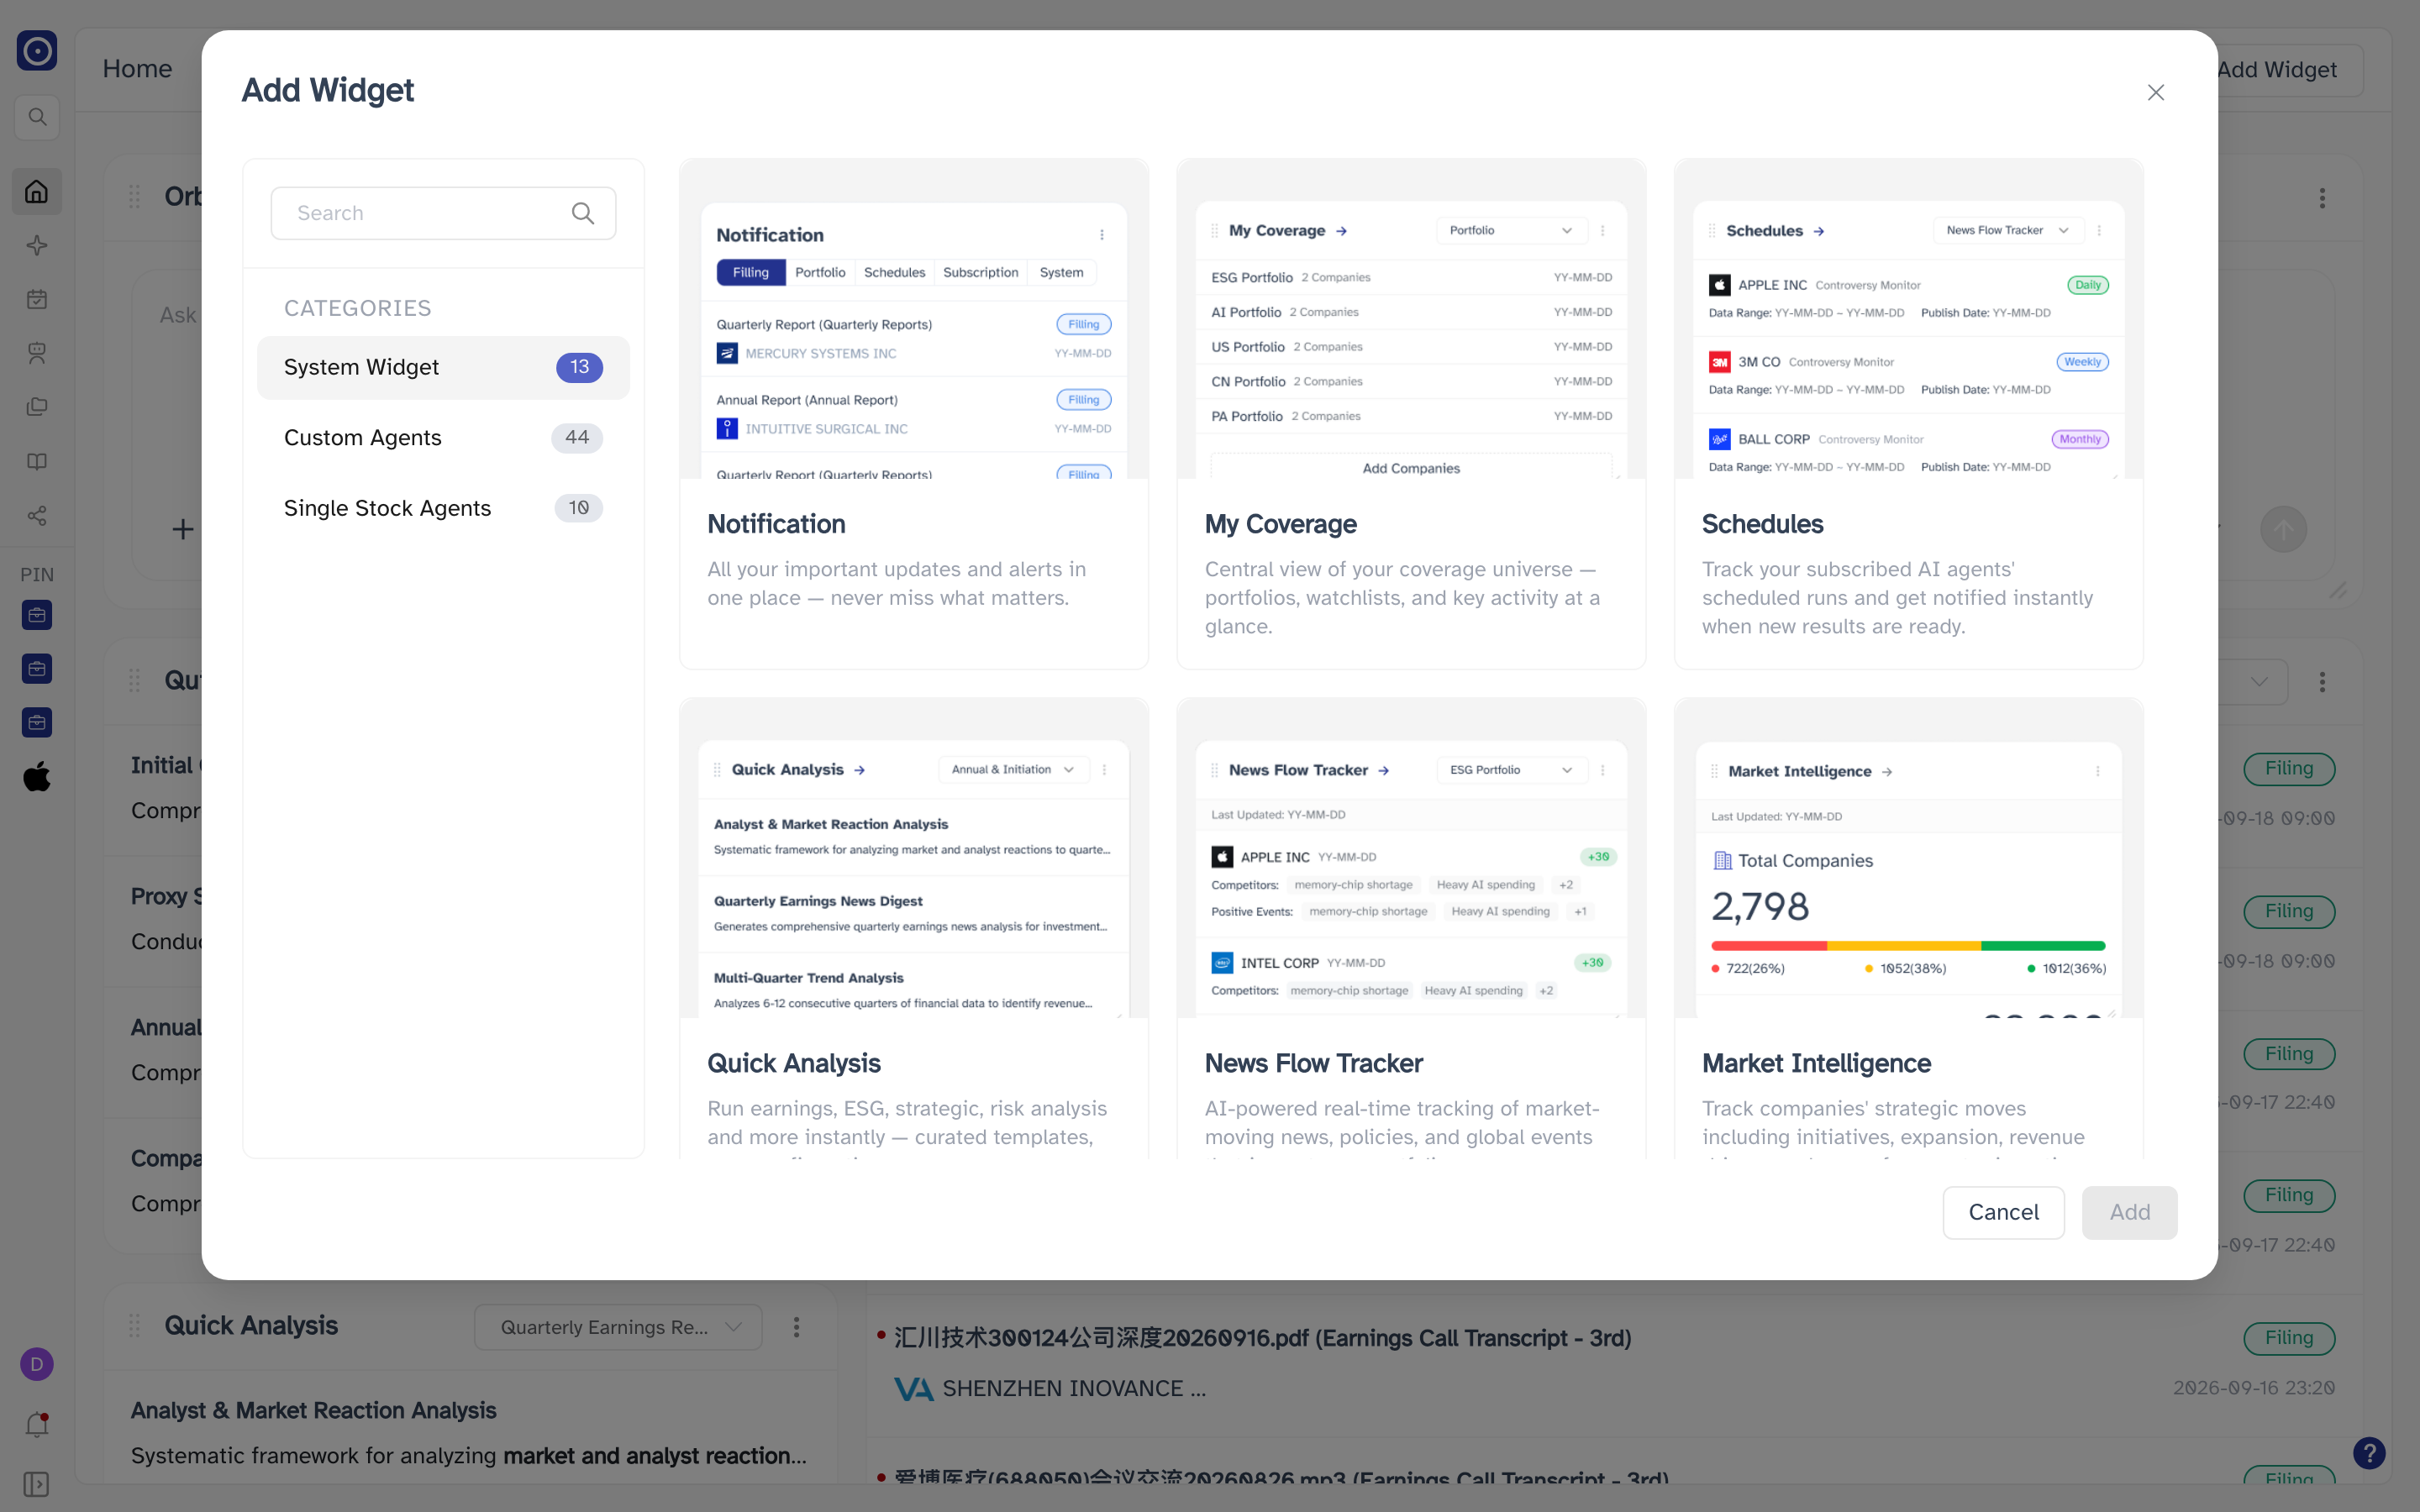
Add Widget opens on a gallery with three categories down its left side. The system set is the same for every account; the other two are as long as your own list of agents, and the count beside each category is how many cards are in it right now.
| Category | What its cards are |
|---|---|
| System Widget | The thirteen widgets Orbit builds. Fixed — you cannot edit, delete or replace them. Written up below. |
| Custom Agents | One card per custom agent you have built, with what it covers and the companies it runs on. |
| Single Stock Agents | One card per single-stock agent — a card per company you follow. |
All three behave the same way once you pick from them: tick the cards you want, press Add, and each one arrives on the dashboard as a widget. The footer counts what you have ticked, and Add stays greyed out until you tick something. There is a search box above the categories, which filters the cards of the category you are on.
The thirteen system widgets
This is the fixed set, shown in the order the gallery lists them so you can read across from one to the other. Each entry says what the widget shows, what you can do inside it, and where its title takes you — with a picture of the widget taken from a dashboard that has all thirteen on it.
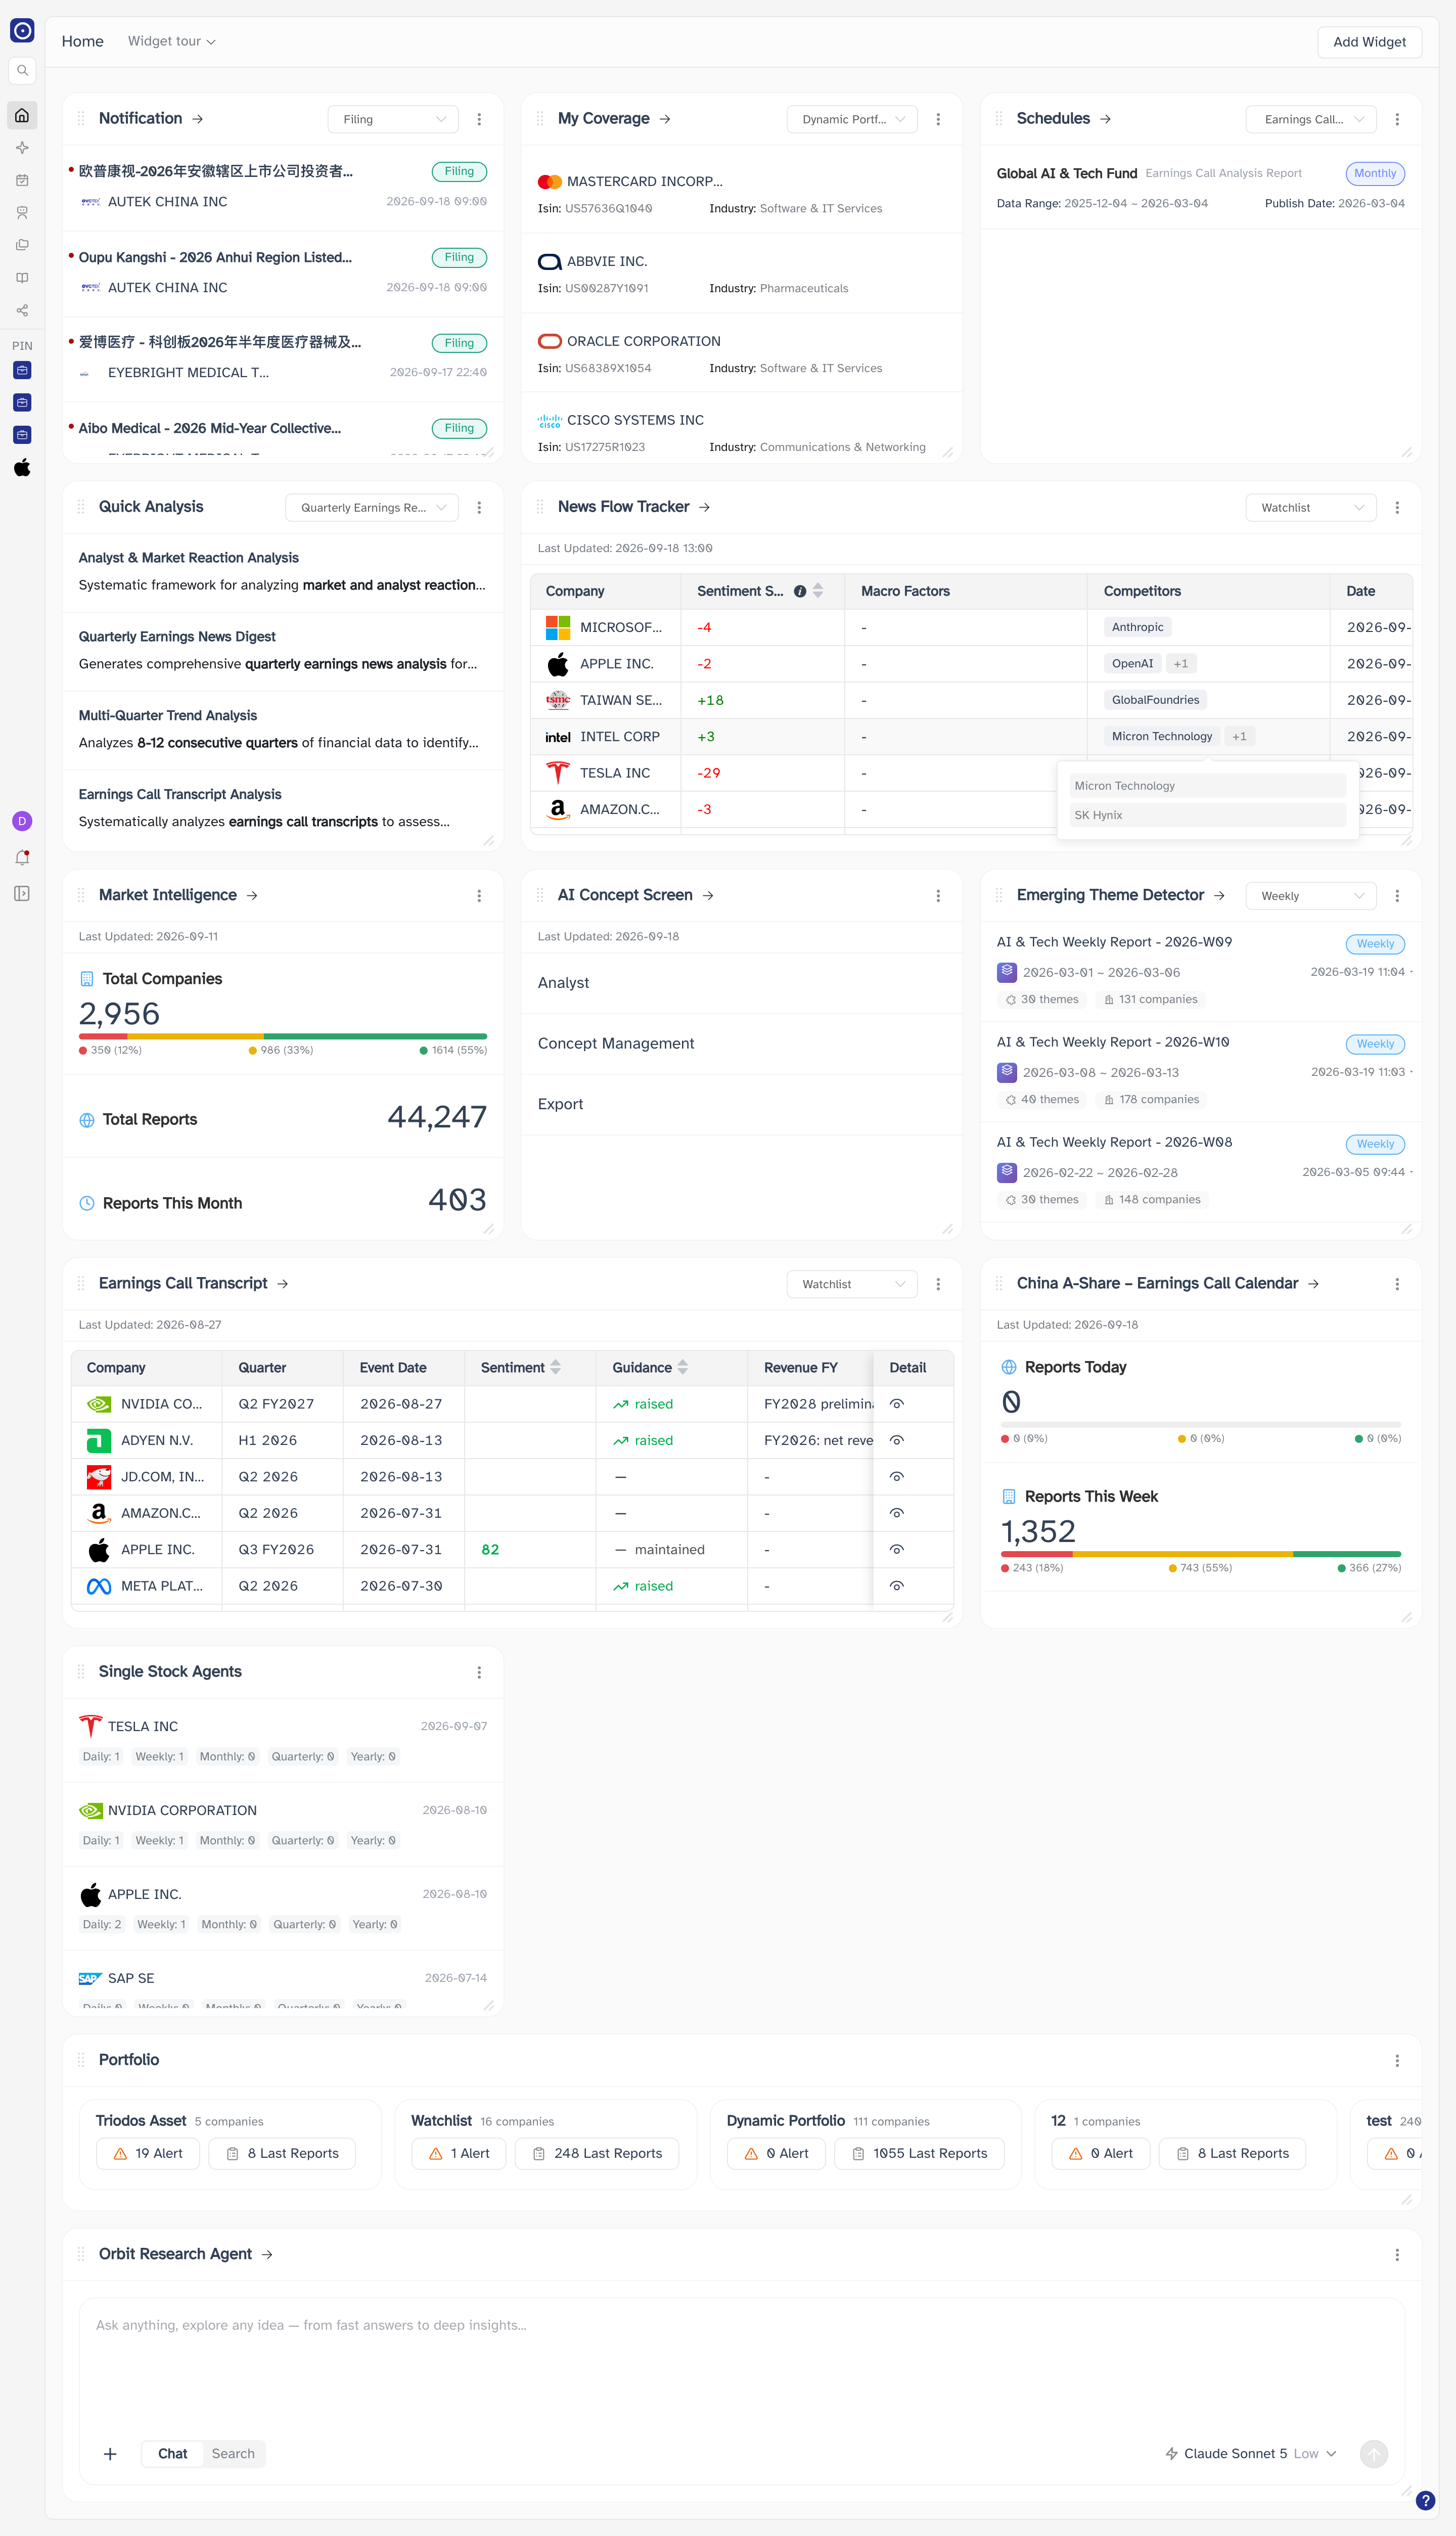
Room is how wide the widget is when you first add it. The grid is three columns, so anything wider than one column pushes its neighbours down the page — and you can resize it afterwards either way. Title opens is where a click on the widget's title lands you; a dash means the title is not clickable. Names that appear as links go to a page in this manual; the rest are pages that are not written up here yet.
| Widget | What it shows | Room | Title opens |
|---|---|---|---|
| Notification | Alerts about the companies you cover. | 1 column | Notification |
| My Coverage | The companies on one of your portfolios. | 1 column | Portfolio Management |
| Schedules | The reports your subscribed agents have produced. | 1 column | Schedules |
| Quick Analysis | Ready-written analyses you can run as they are. | 1 column | — |
| News Flow Tracker | Sentiment shifts, macro factors and rivals, per company. | 2 columns | News Flow Tracker |
| Market Intelligence | How much Orbit is watching, and its red / amber / green split. | 1 column | Market Intelligence |
| AI Concept Screen | Three shortcuts into the concept screens. | 1 column | AI Concept Screen |
| Earnings Call Transcript | Processed earnings calls with sentiment and guidance. | 2 columns | Earnings Call Transcript |
| Emerging Theme Detector | The theme reports Orbit has produced for you. | 1 column | Theme Discovery |
| China A-Share – Earnings Call Calendar | Today's and this week's A-share calls. | 1 column | A-share earnings call calendar |
| Single Stock Agents | Your per-company agents, and how often each one reports. | 1 column | — |
| Portfolio | Your pinned portfolios, with alert and report counts. | 3 columns | — |
| Orbit Research Agent | A prompt box for asking about anything in Orbit. | 3 columns | New Chat |
Every picture below is the widget at its default width — the size it asks for when you add it. A widget you have dragged wider looks different: it spreads out, and tables that were cut off at the right have room for their later columns.
The last two widgets are full-width strips, and at the width they are drawn they are wider than a column of text. Those two pictures are shown at full size and run past the right-hand edge — scroll them sideways to follow the row.
Notification
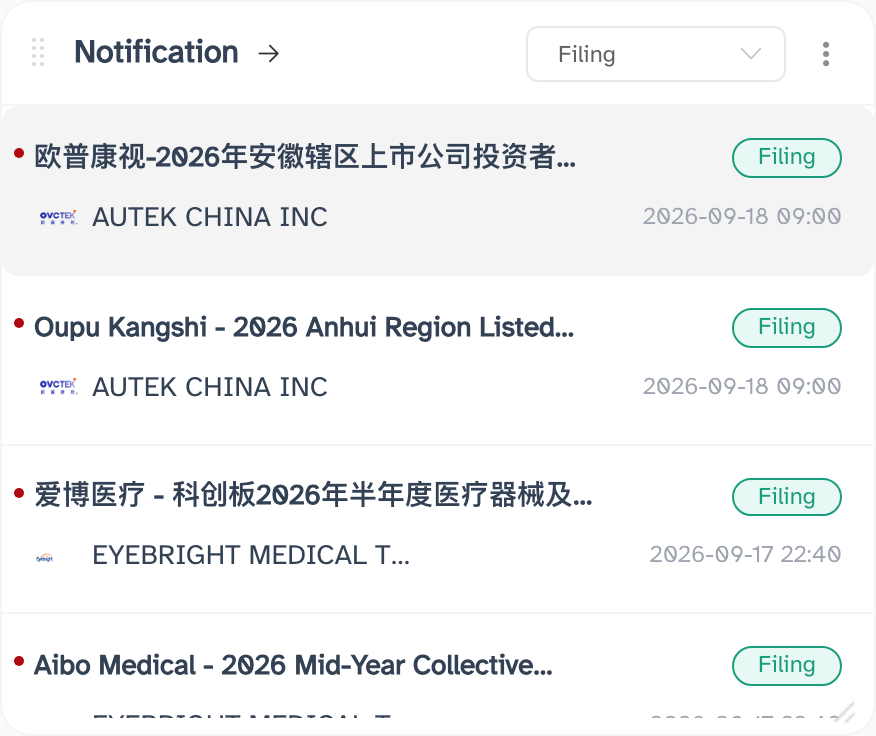
Everything Orbit has flagged for the companies you cover, newest first. Each row carries the headline, the company it is about, the time it arrived, and a tag naming the kind of event — a filing, a report, a news item.
The dropdown beside the title narrows the list to a single kind of event. Which kinds you can choose from depends on your account, so the list is not the same for everyone. Clicking the title opens Notifications, and clicking one of the alerts opens that same page with the alert already selected.
My Coverage
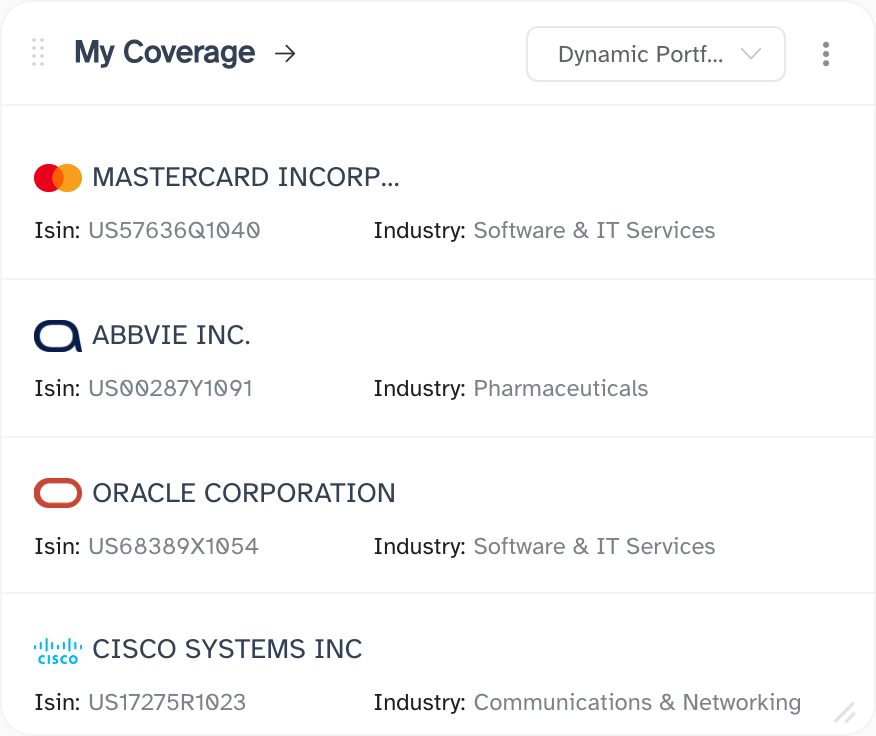
The companies on one of your portfolios, one row each: the company's logo and name, its ISIN, and the industry it sits in. The dropdown beside the title switches which portfolio the list is drawn from, and the card comes back to whichever you chose last.
Clicking the title opens Portfolio Management — the page where the portfolios themselves are put together and their companies picked.
Schedules
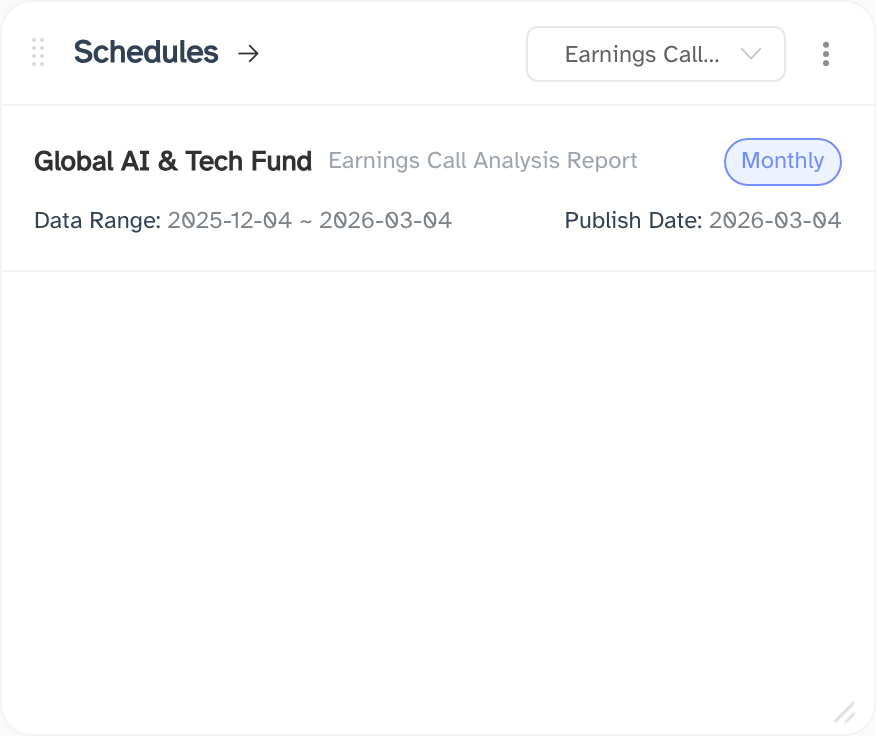
The reports your subscriptions have produced. Each entry names the subscription and the agent that writes it, tags how often it runs — Monthly, Weekly — and gives the range of data the report covers along with the date it was published.
The dropdown beside the title narrows the list to one agent. Clicking the title opens Schedules, where the subscriptions themselves are set up and switched on or off.
Quick Analysis
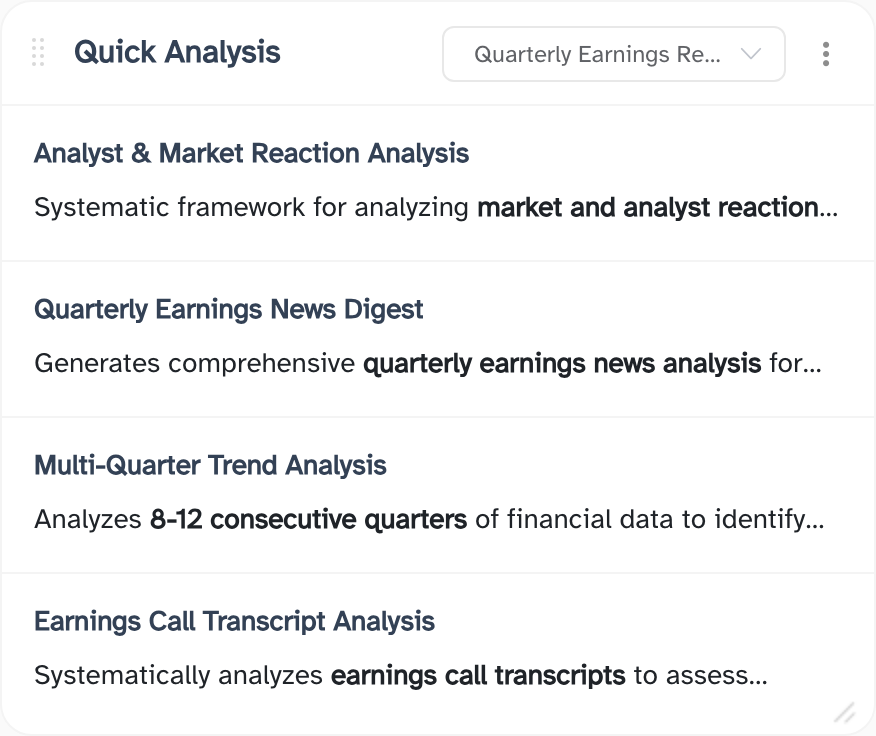
A short menu of analyses you can run without setting anything up. The dropdown picks the group — Quarterly Earnings Research, Annual & Initiation, ESG & Sustainability, Thematic & Strategic or Risk & Event-Driven — and the card lists the prompts inside it.
Each entry is a brief that has already been written: Analyst & Market Reaction Analysis, Quarterly Earnings News Digest, Multi-Quarter Trend Analysis, Earnings Call Transcript Analysis. Clicking one opens it in a dialog. This widget has no arrow, so its title does nothing.
News Flow Tracker
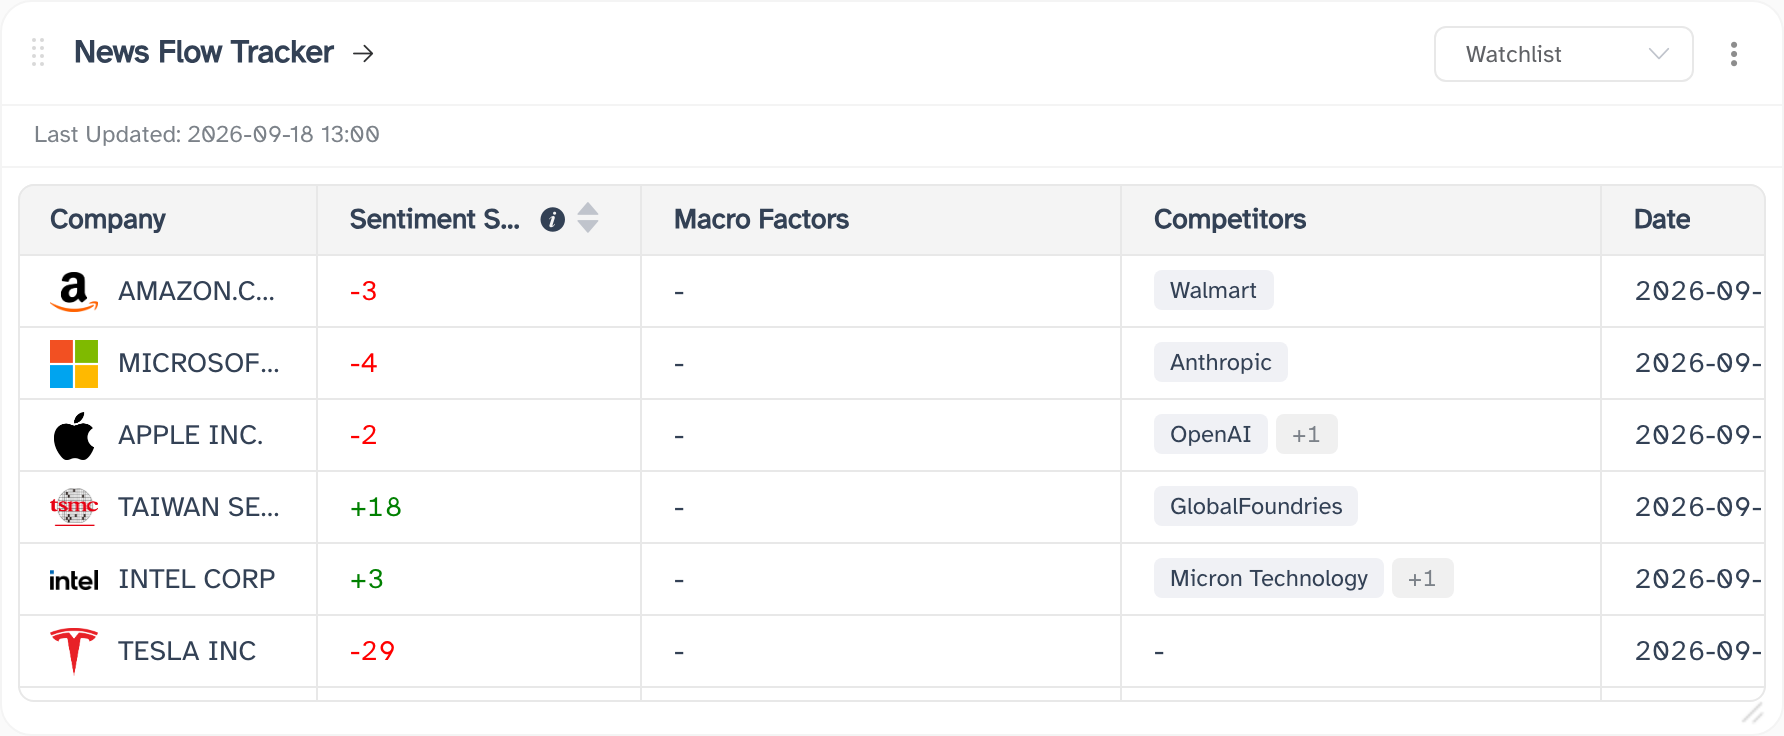
What the news is doing to the companies you follow, one row each. Sentiment Shift scores how far the tone around a company has moved; Macro Factors names any wider force at work; Competitors lists the rivals the news puts it up against, with +n when there are more than the two that fit. The Date column is when the row was last refreshed, and the Last Updated stamp at the top of the card covers the whole table.
The dropdown scopes the card to one portfolio or watchlist. At two columns the table carries more columns than the card shows at once, so widen it if you want everything in view at the same time. Clicking the title opens News Flow Tracker on its Detail tab; clicking a row opens that one record — see News flow detail.
Market Intelligence
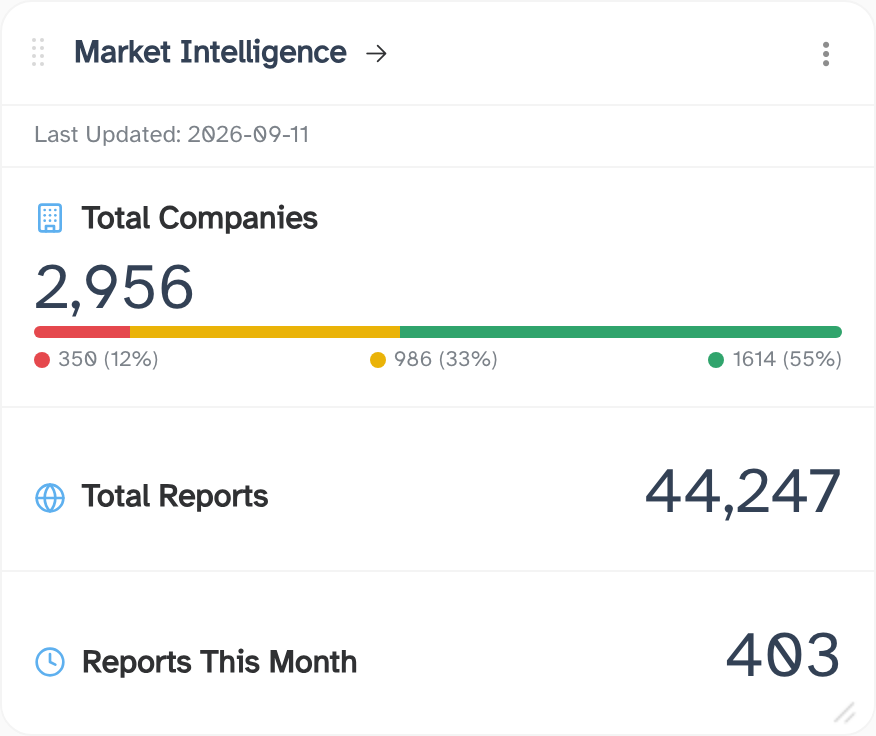
How much of the market Orbit is watching on your behalf, and how that coverage is leaning. Total Companies carries a red / amber / green breakdown with a count and a percentage for each band, so the balance is readable at a glance without opening anything. Total Reports and Reports This Month count the documents behind those companies.
The Last Updated line says when the figures were last pulled, and it can sit several days back — the numbers here are not live. Clicking the title opens Market Intelligence.
AI Concept Screen
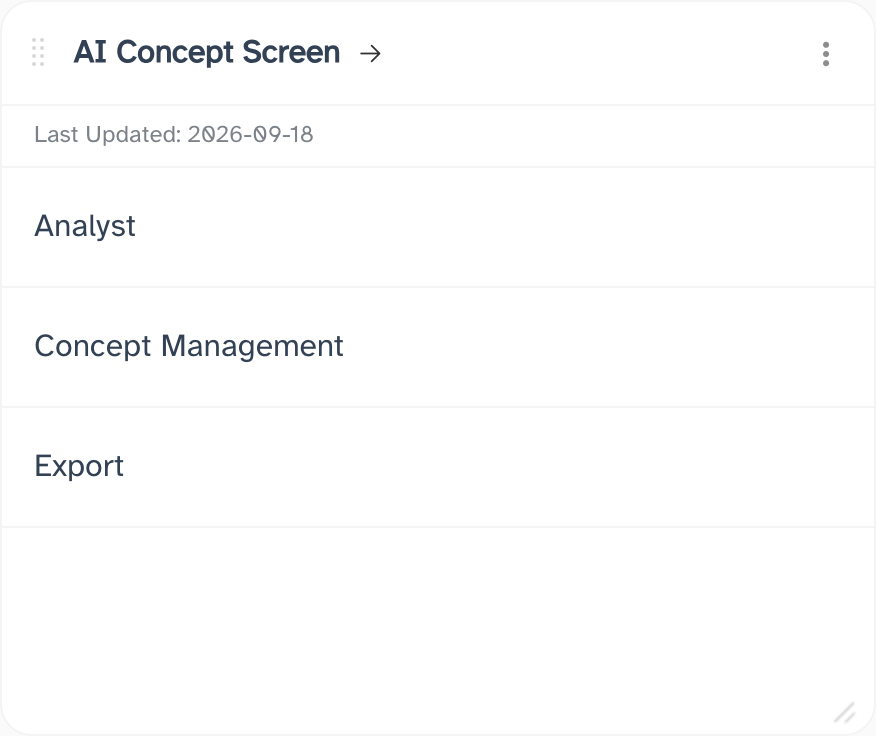
Three shortcuts into the concept screens. Analyst opens the analyst view, Concept Management the list where you define and edit the concepts you scan for, and Export the place you pull a scan's results out. Clicking the title lands in the same place as Analyst.
Earnings Call Transcript
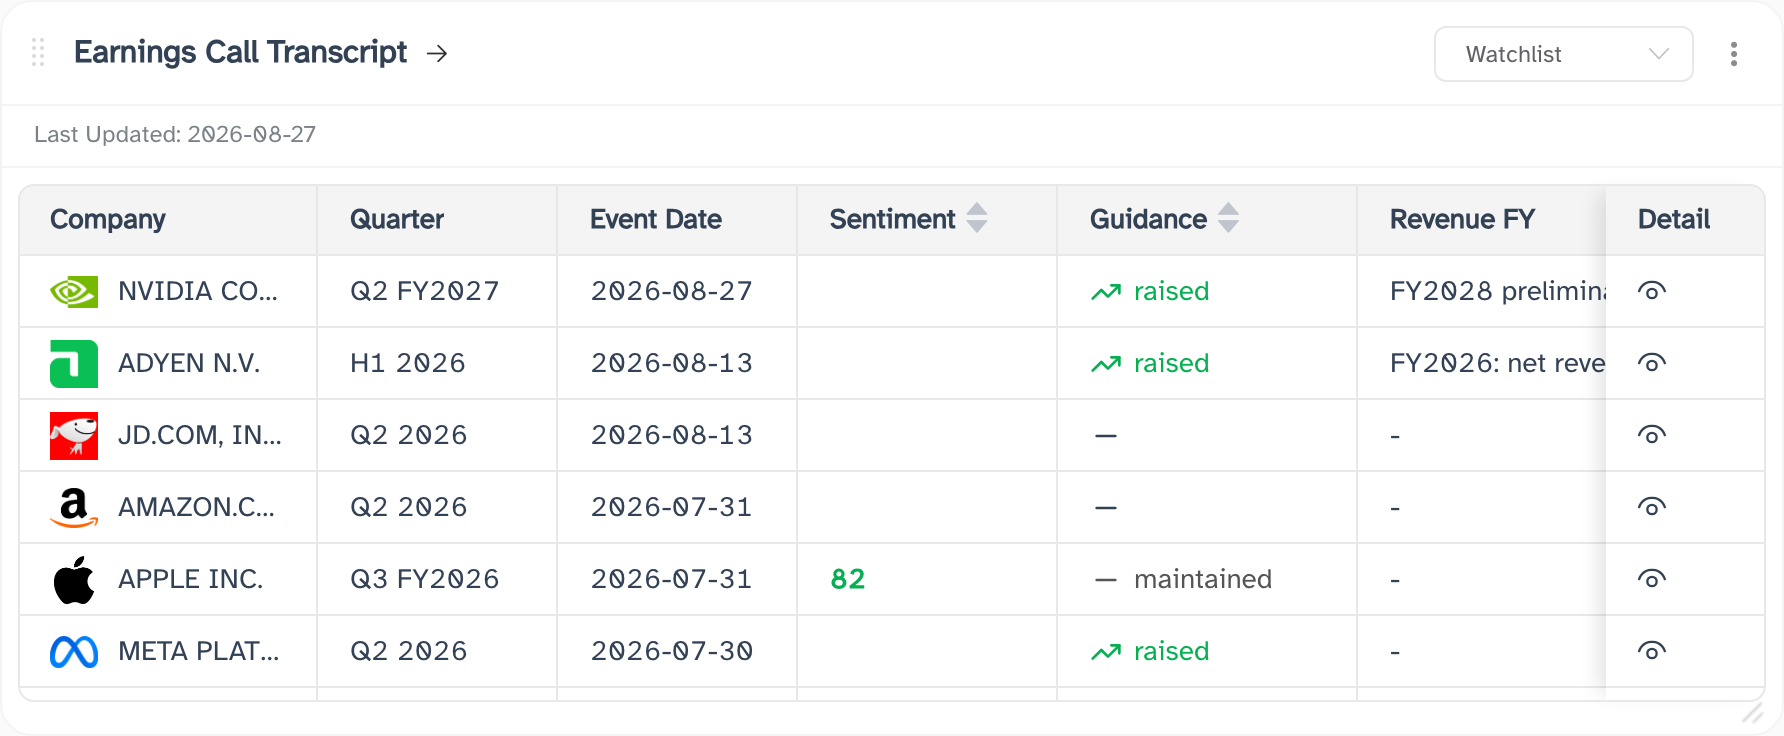
One row per processed earnings call: the company, the quarter it covers, the date of the call, a sentiment score, the guidance stance, the revenue figure, and an eye icon in Detail that opens the call itself.
Sentiment is a score out of 100 and only appears where Orbit could compute one — in the picture only Apple has a figure. The bands behind the colour are the same ones described on Earnings Call Transcript: 70 and above green, 50 to 69 amber, below 50 red. The dropdown scopes the card to one portfolio or watchlist, and clicking the title opens the full list.
Emerging Theme Detector
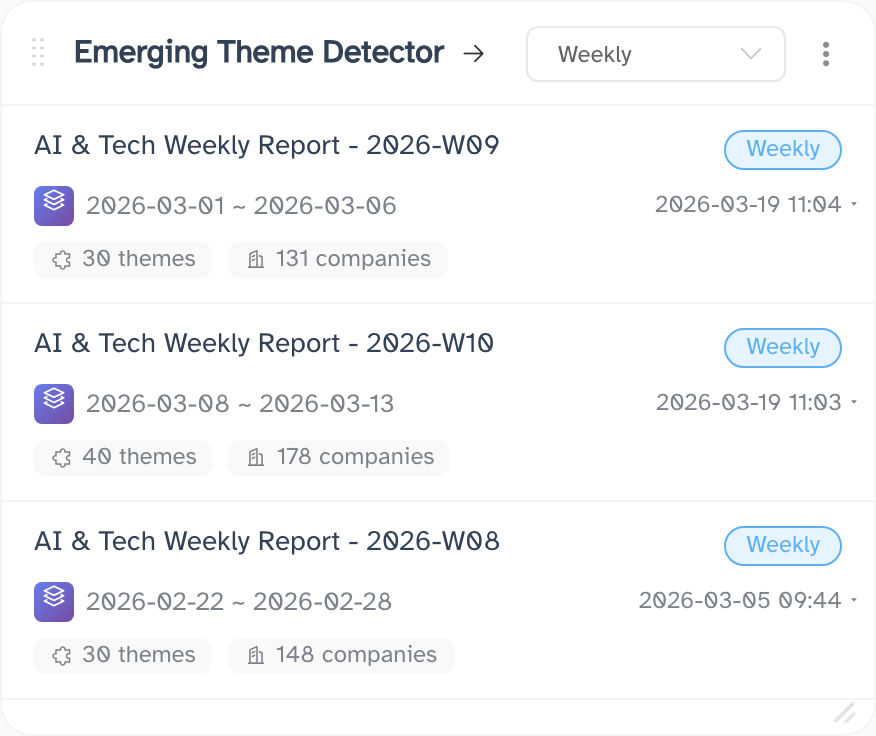
The theme reports Orbit has produced for you. Each entry names the report and its week — the picture shows 2026-W09, W10 and W08 — gives the range of dates it covers and the moment it was generated, then counts what it turned up: 30 themes across 131 companies, and so on.
The dropdown switches between Weekly and Monthly reports. Clicking the title opens Theme Discovery, where the report itself is readable in full.
China A-Share – Earnings Call Calendar
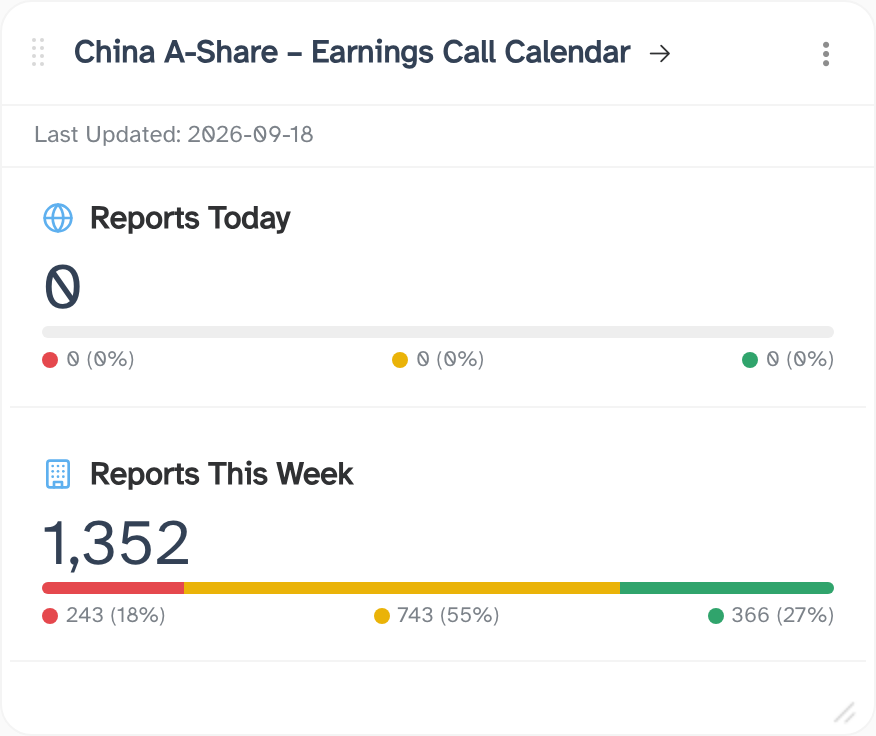
Two counters for the China A-share market: Reports Today and Reports This Week. Each carries the same red / amber / green breakdown as Market Intelligence, with a count and a percentage per band, and a Last Updated line above.
Clicking the title opens the A-share earnings call calendar. This is the only widget in the set that covers a single market.
Single Stock Agents
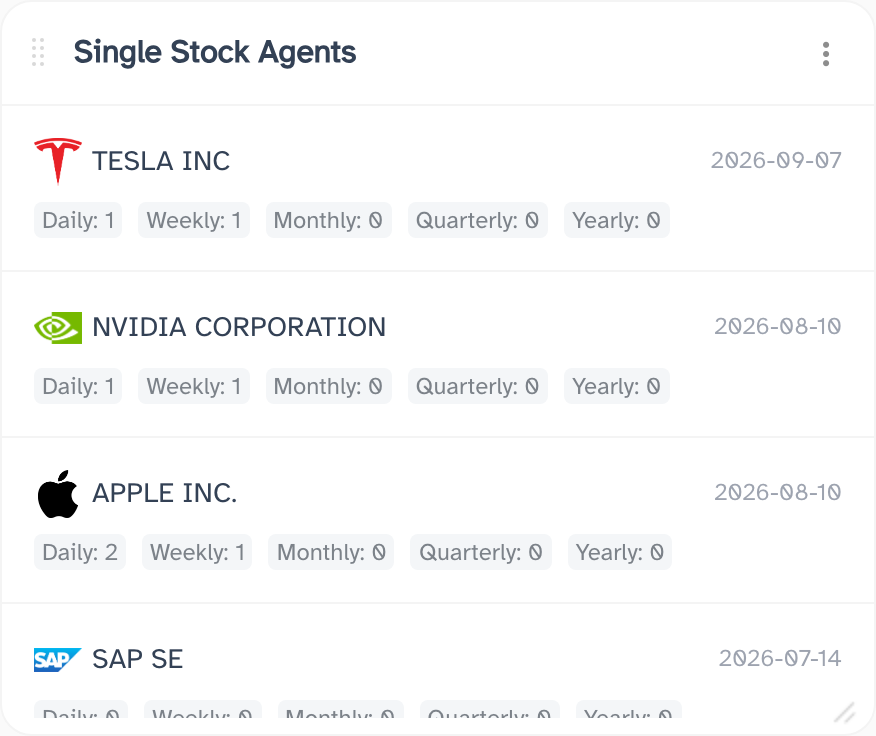
One entry per company you have built a single-stock agent for: the logo, the company name, and the date it was last touched. Underneath, five tags count the reports that agent has produced at each cadence — Daily, Weekly, Monthly, Quarterly, Yearly. A zero is normal on the longer cadences.
This widget has no arrow. Clicking a company opens that agent's page, which is the same page the rail leads to under Single Stock Agents.
Portfolio

The portfolios you have pinned, as a single row. Each card carries the portfolio's name, its company count, and two chips: how many alerts it is carrying and how many reports have been written for it. Because the row runs sideways, the card stays short no matter how many portfolios you pin — but a portfolio past the right-hand edge needs the card dragged wider before you can reach it.
This widget has no arrow. Clicking a portfolio opens its detail page, the same one described under Portfolio detail.
Orbit Research Agent
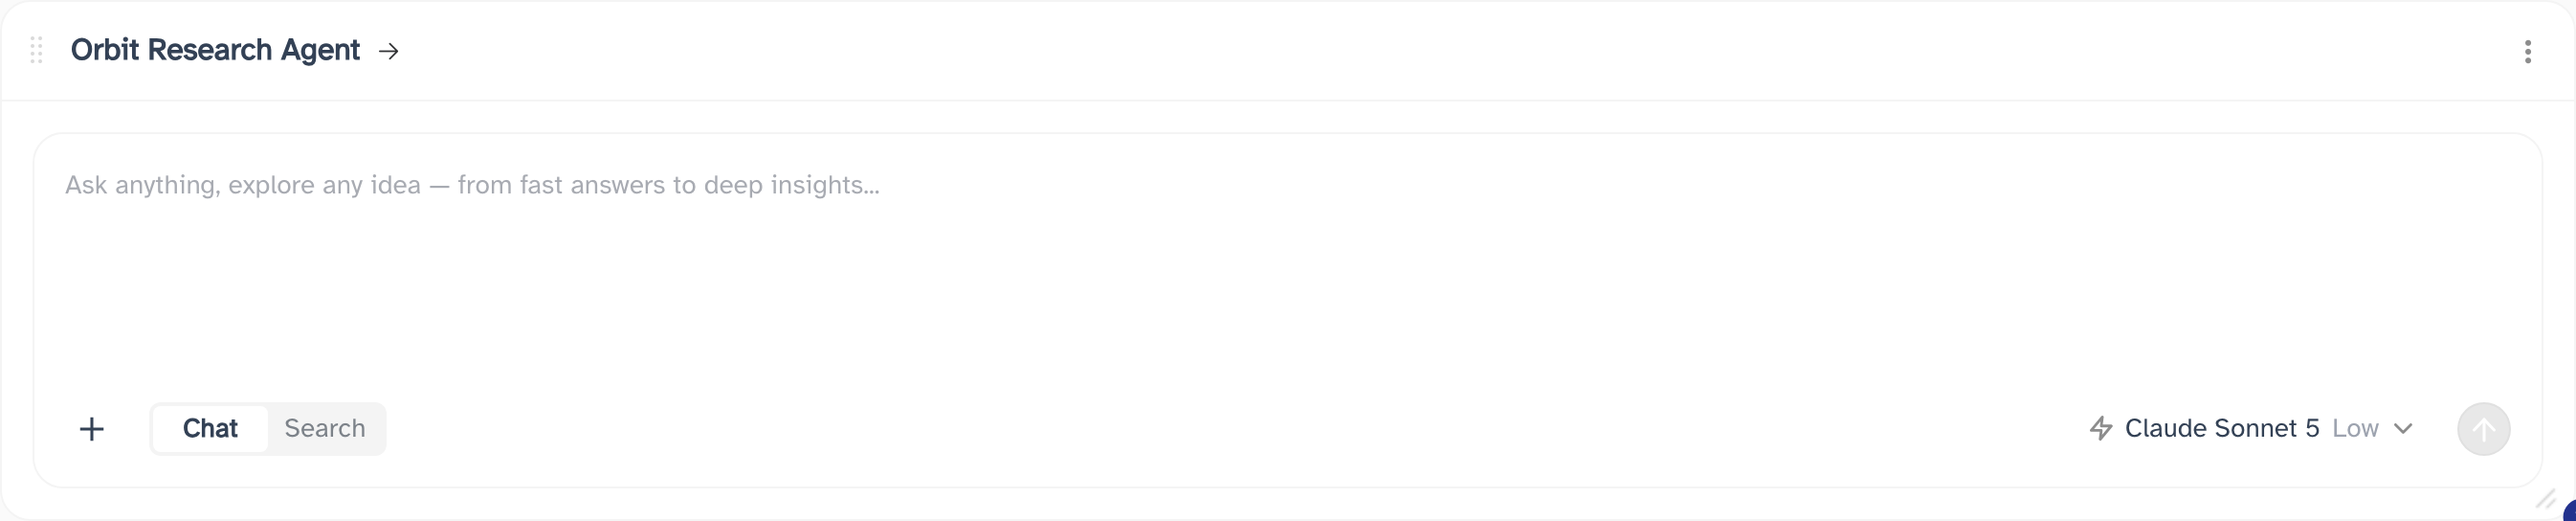
A prompt box that takes the full width of the dashboard. Ask about your markets, your holdings or a report you have read, and send it from here rather than opening chat first. The row along the bottom is the same one the full screen has: + to attach a file, Chat and Search to choose how the agent answers, the model it will use, and the send button.
Clicking the title opens New Chat, where the same conversation continues with its history beside it.
Your own agents as widgets
The other two categories are built from the agents you have made, so they are as long as your own list. Tick a card in either one and you get a widget showing that agent's latest output — one widget per agent, not one widget per category.
Custom Agents
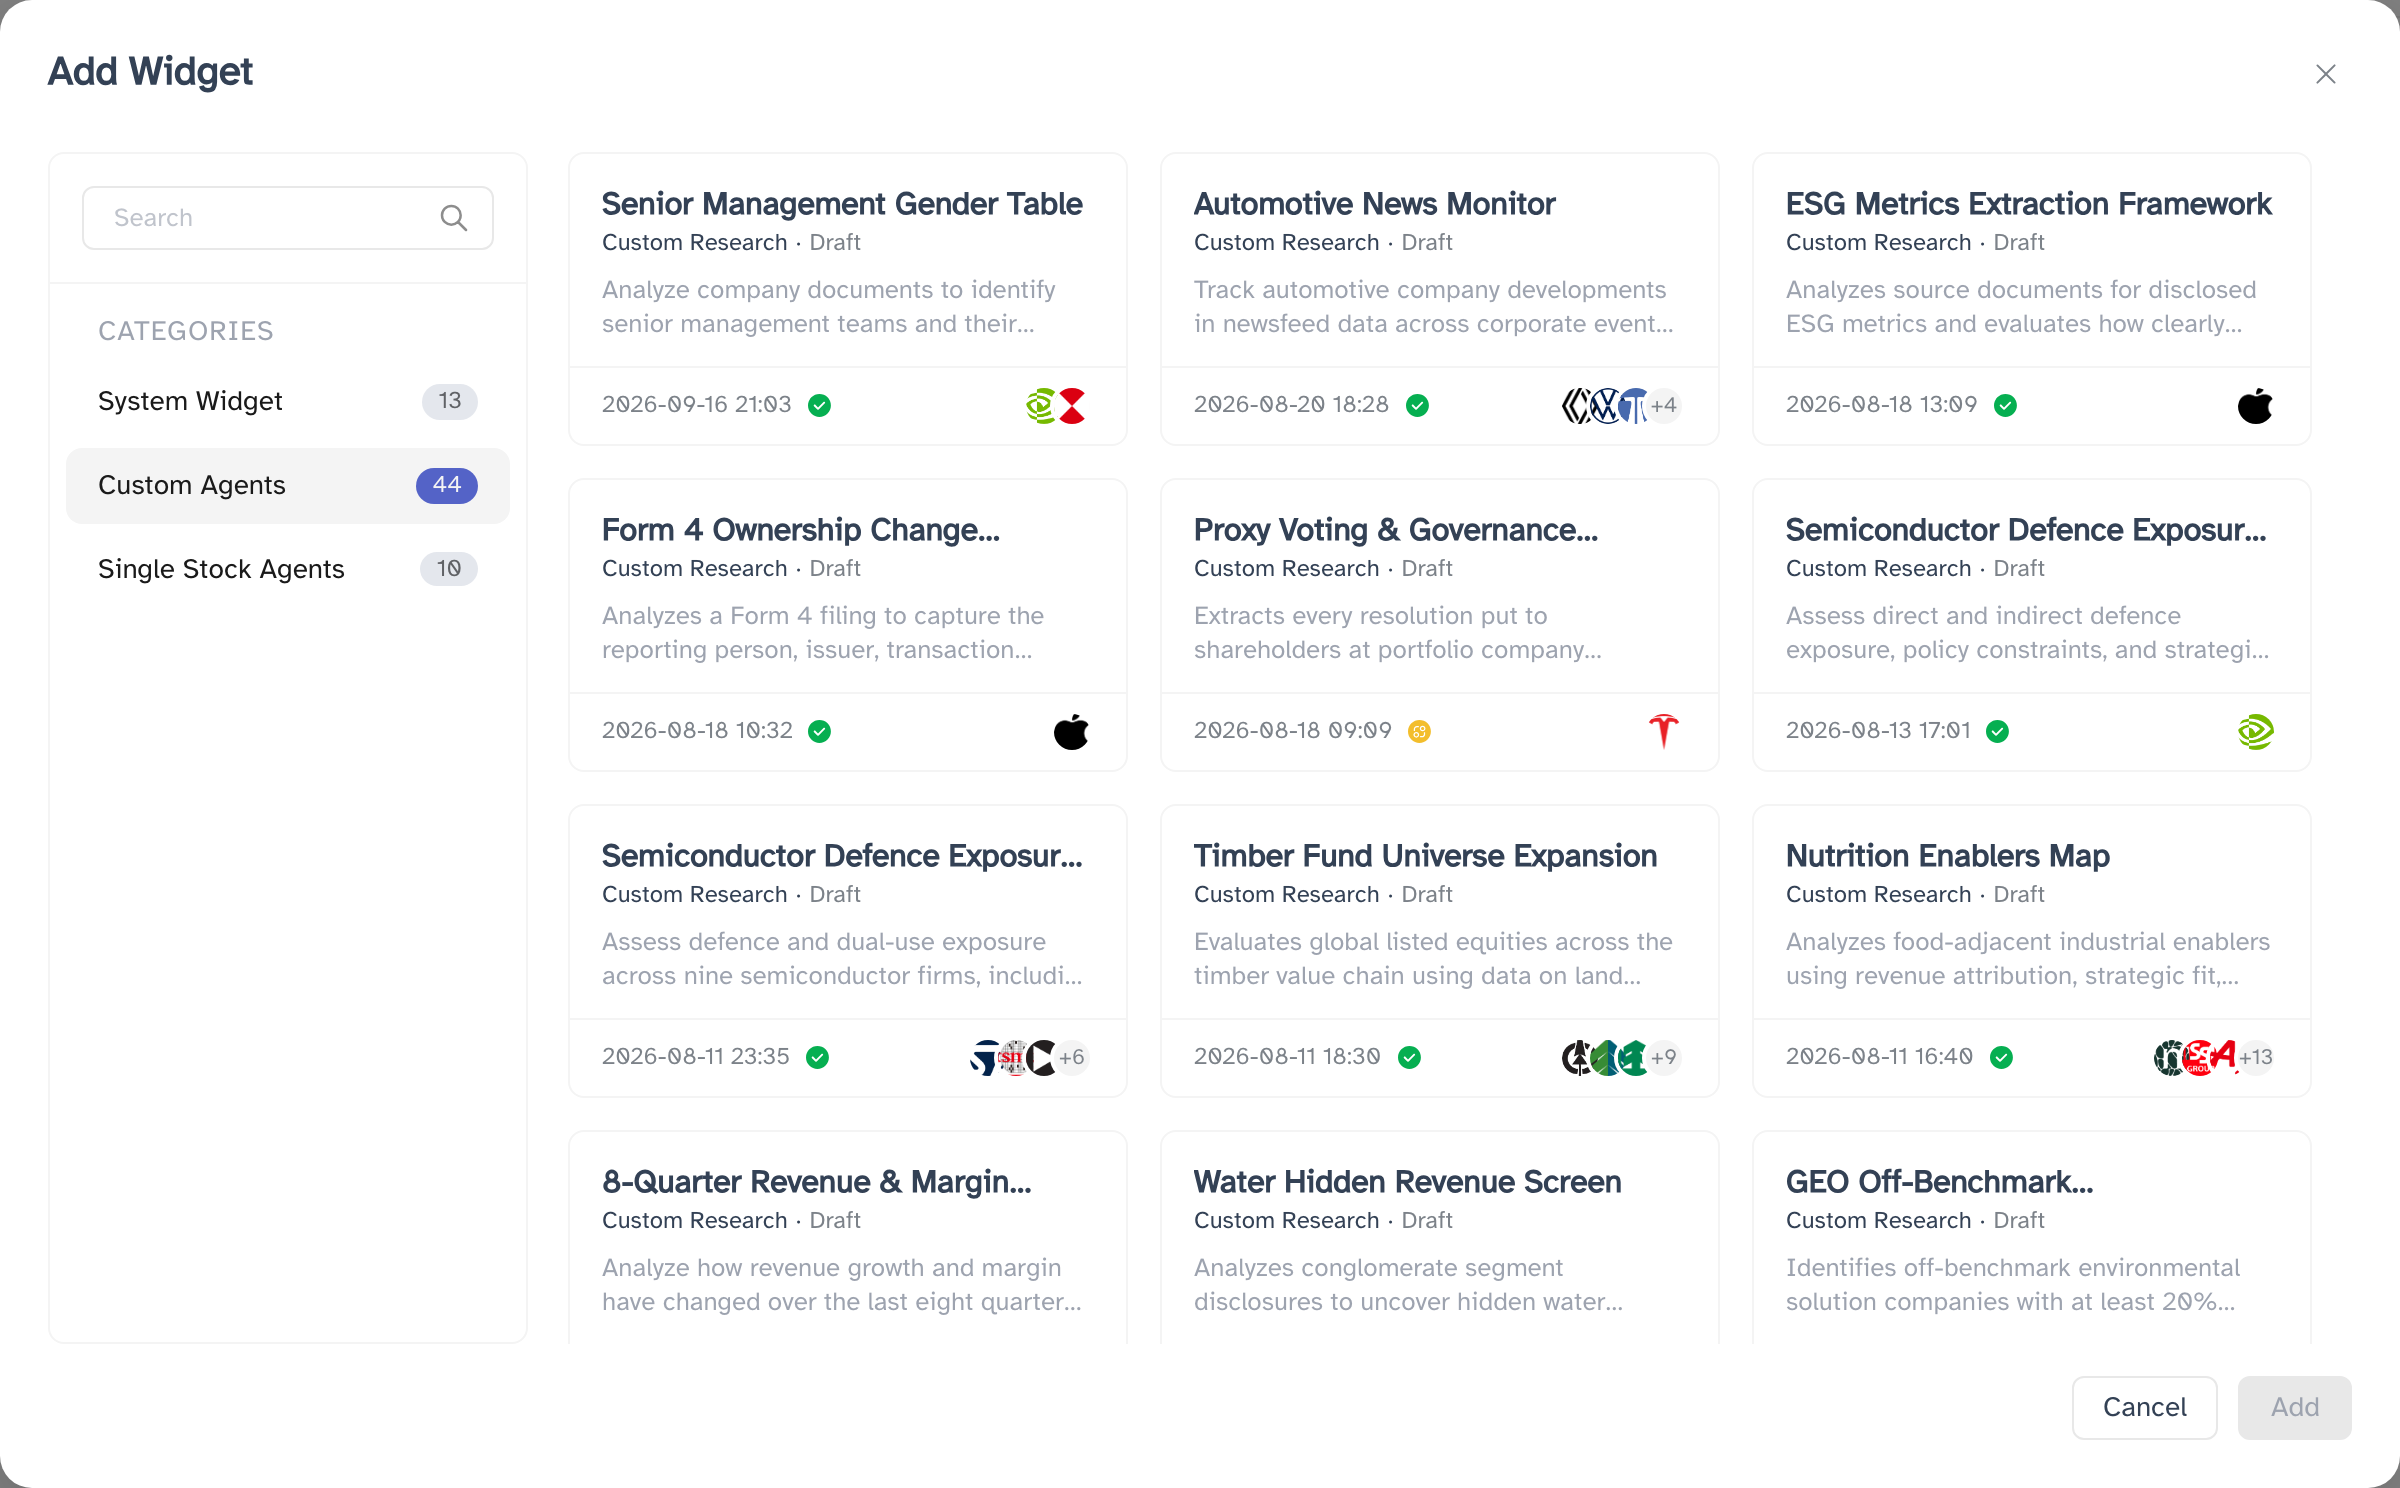
Reading a card top to bottom: the agent's name; a line saying what kind it is —
Custom Research, or RegAware Regulations for one set up to
watch regulation — with whether it is published or still a draft; the description you gave it;
and along the bottom, the date it was last touched, and the companies it runs on shown as up to
three logos with a +n where there are more. Hovering those logos lists the
companies by name, and clicking one opens that company.
Single Stock Agents
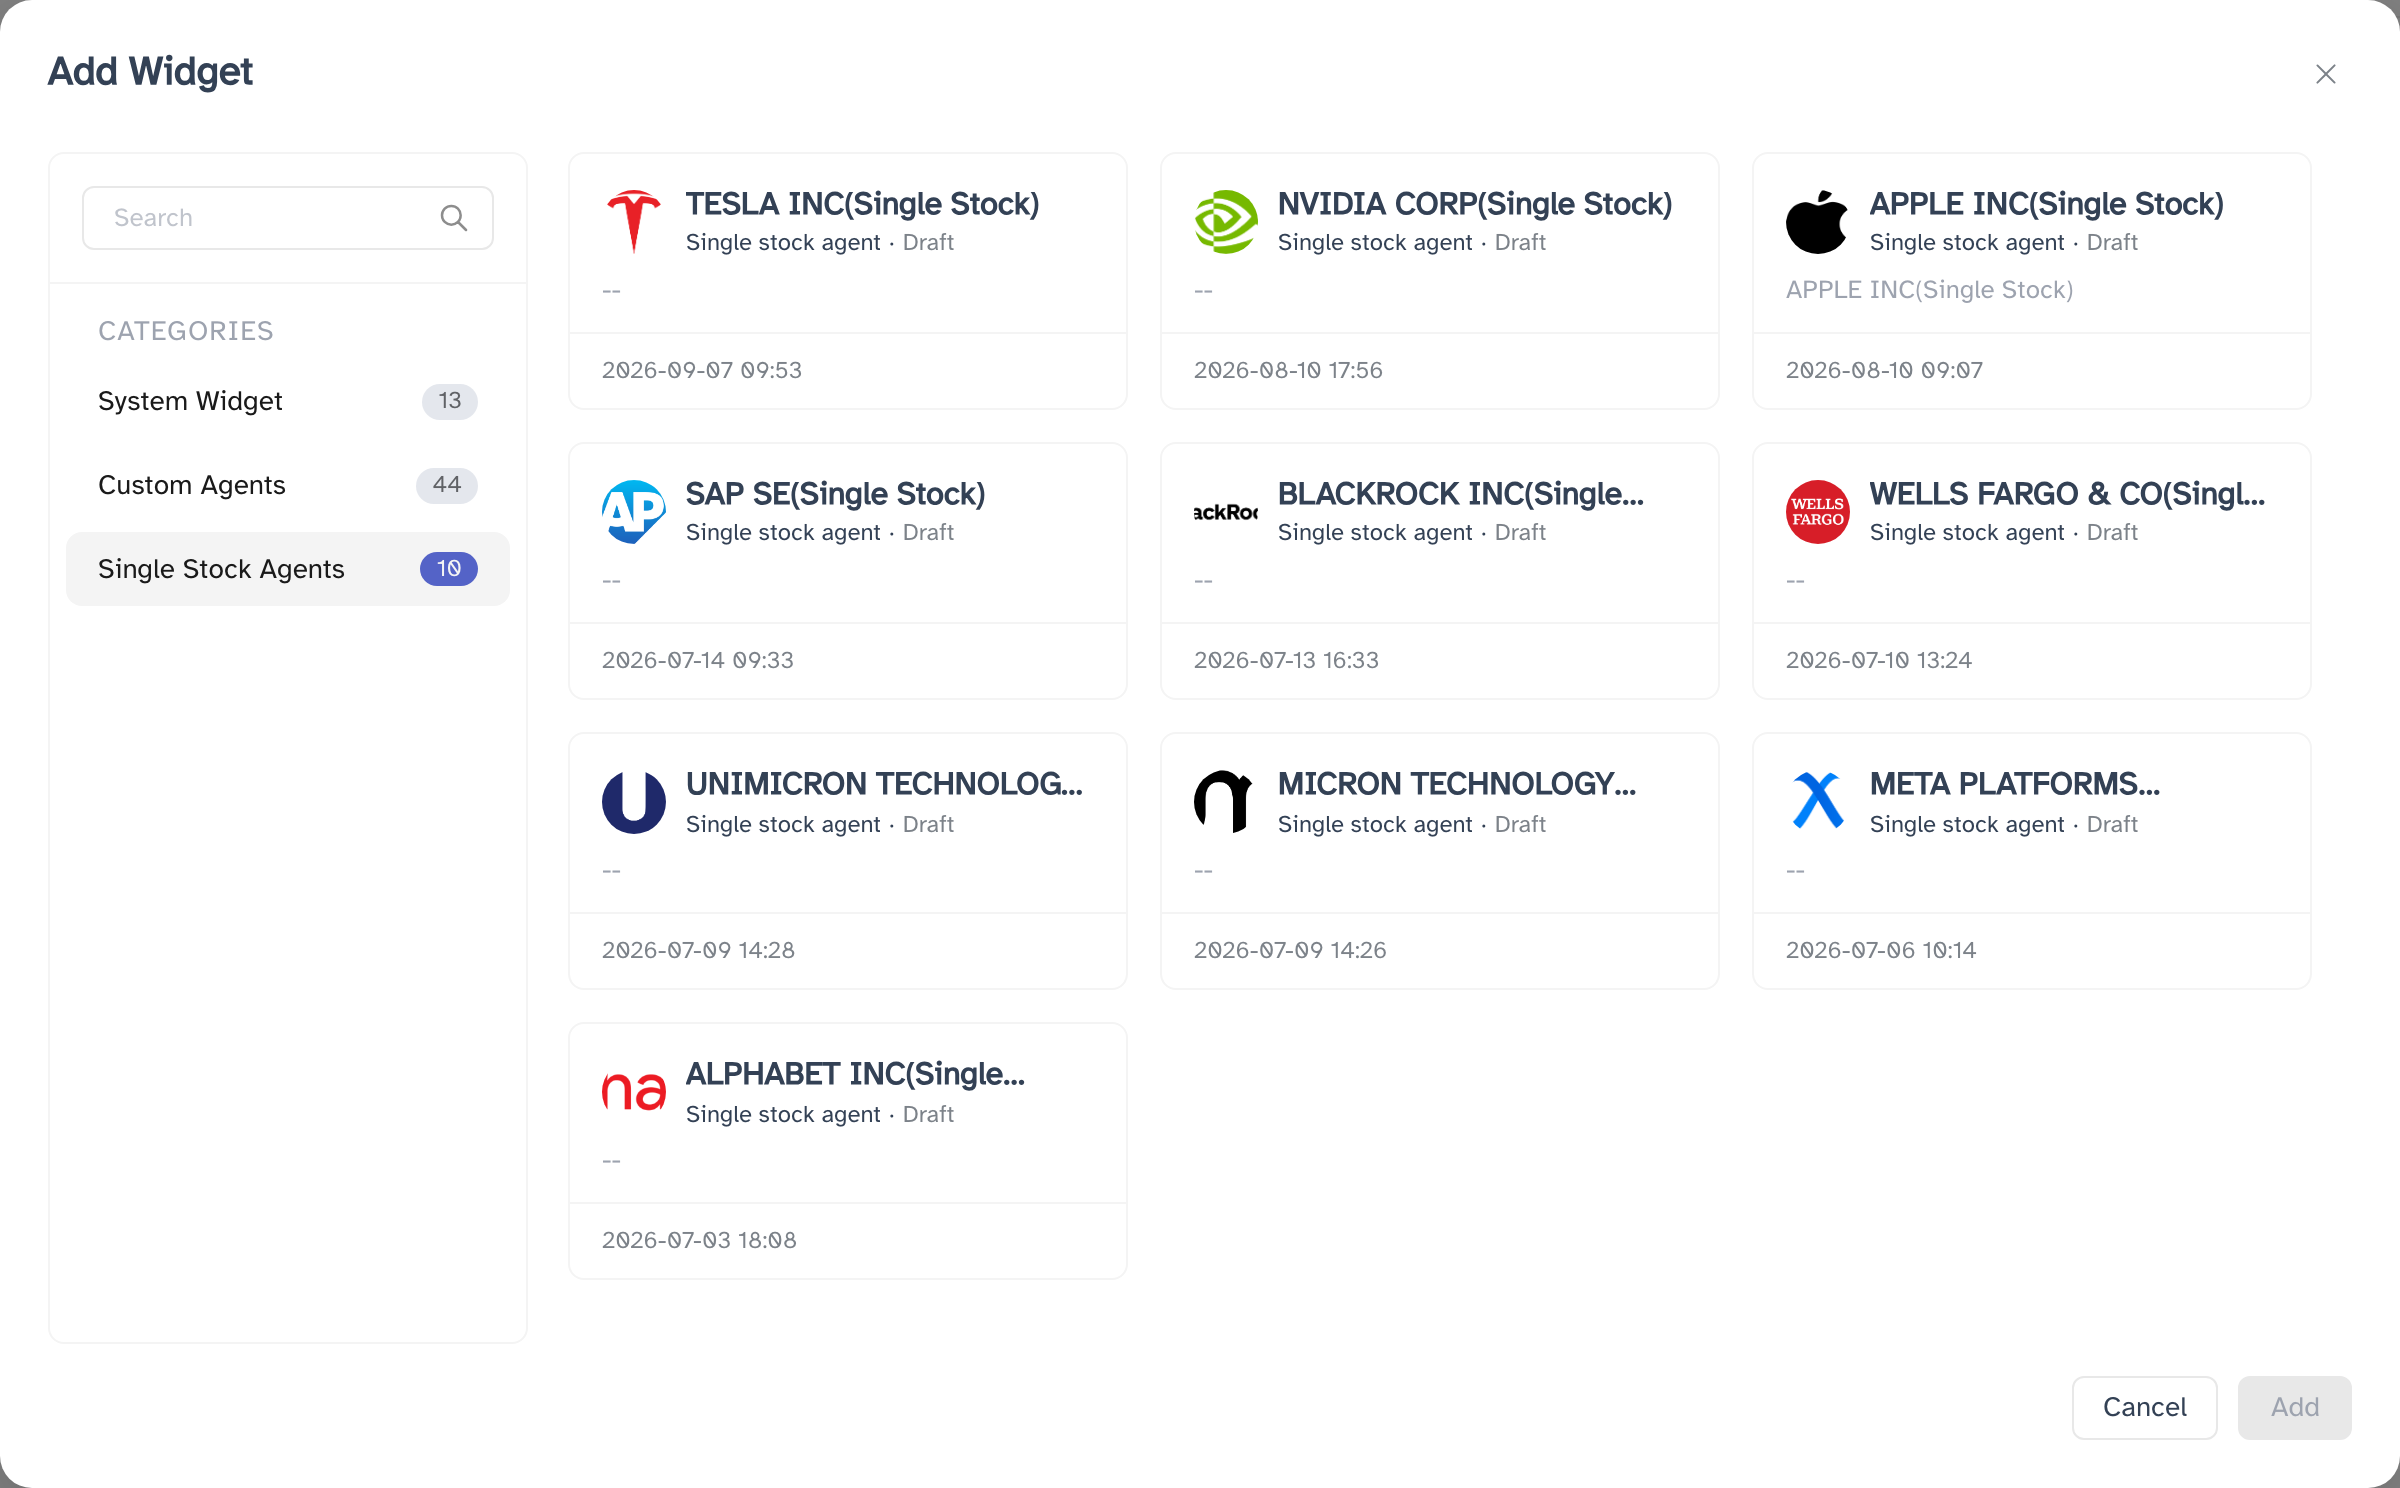
One card per single-stock agent, so here a card is a company rather than a piece of research. The company's logo and name lead it, the line underneath reads Single stock agent with its draft or published state, and the stamp along the bottom is when it was last touched. There is no description to read: a single-stock agent is defined by the company it follows, so the card does not repeat that back to you — a dash in that position means the agent has none.
On either kind of card, a small coloured dot sits next to the date once the agent has run: green when a run finished cleanly, amber for one that has not finished, red if it failed. A card with no dot is an agent that has not run at all yet — normal for one you have only just set up.
None of this changes the agent. The gallery is a shortcut: adding a card from here is the same as opening the agent and adding it from its own page.
Where to go from here
Dashboard covers the page these widgets sit on — switching between dashboards, adding and removing widgets, and dragging them into an arrangement that suits you. For the agents behind the last two categories, see Agent Marketplace for the list of everything you own, the custom agent page for one custom agent, and the single stock agent page for one company's.