
Earnings Call Transcript
Orbit reads the transcript of a company's quarterly earnings call and writes up what management actually said — how the quarter went, what they guided for, where they hedged, and what analysts pressed them on. This page lists the calls Orbit has processed. Open one to read the write-up beside the original transcript it was drawn from.
Opening the page
- Open the Dashboard.
- Find the Earnings Call Transcript panel.
- Click the panel's heading to open the list, or click a company row inside the panel to go straight to that company's call.
There is no entry for this page in the left rail — the Dashboard panel is the way in. Opening from a row carries that report through, so you land on the call you clicked rather than on the list.
The list
Every processed call is one row, ordered newest first, so the most recent quarter is always at the top. The table is wide — the last few columns sit off the right-hand edge until you scroll it sideways.
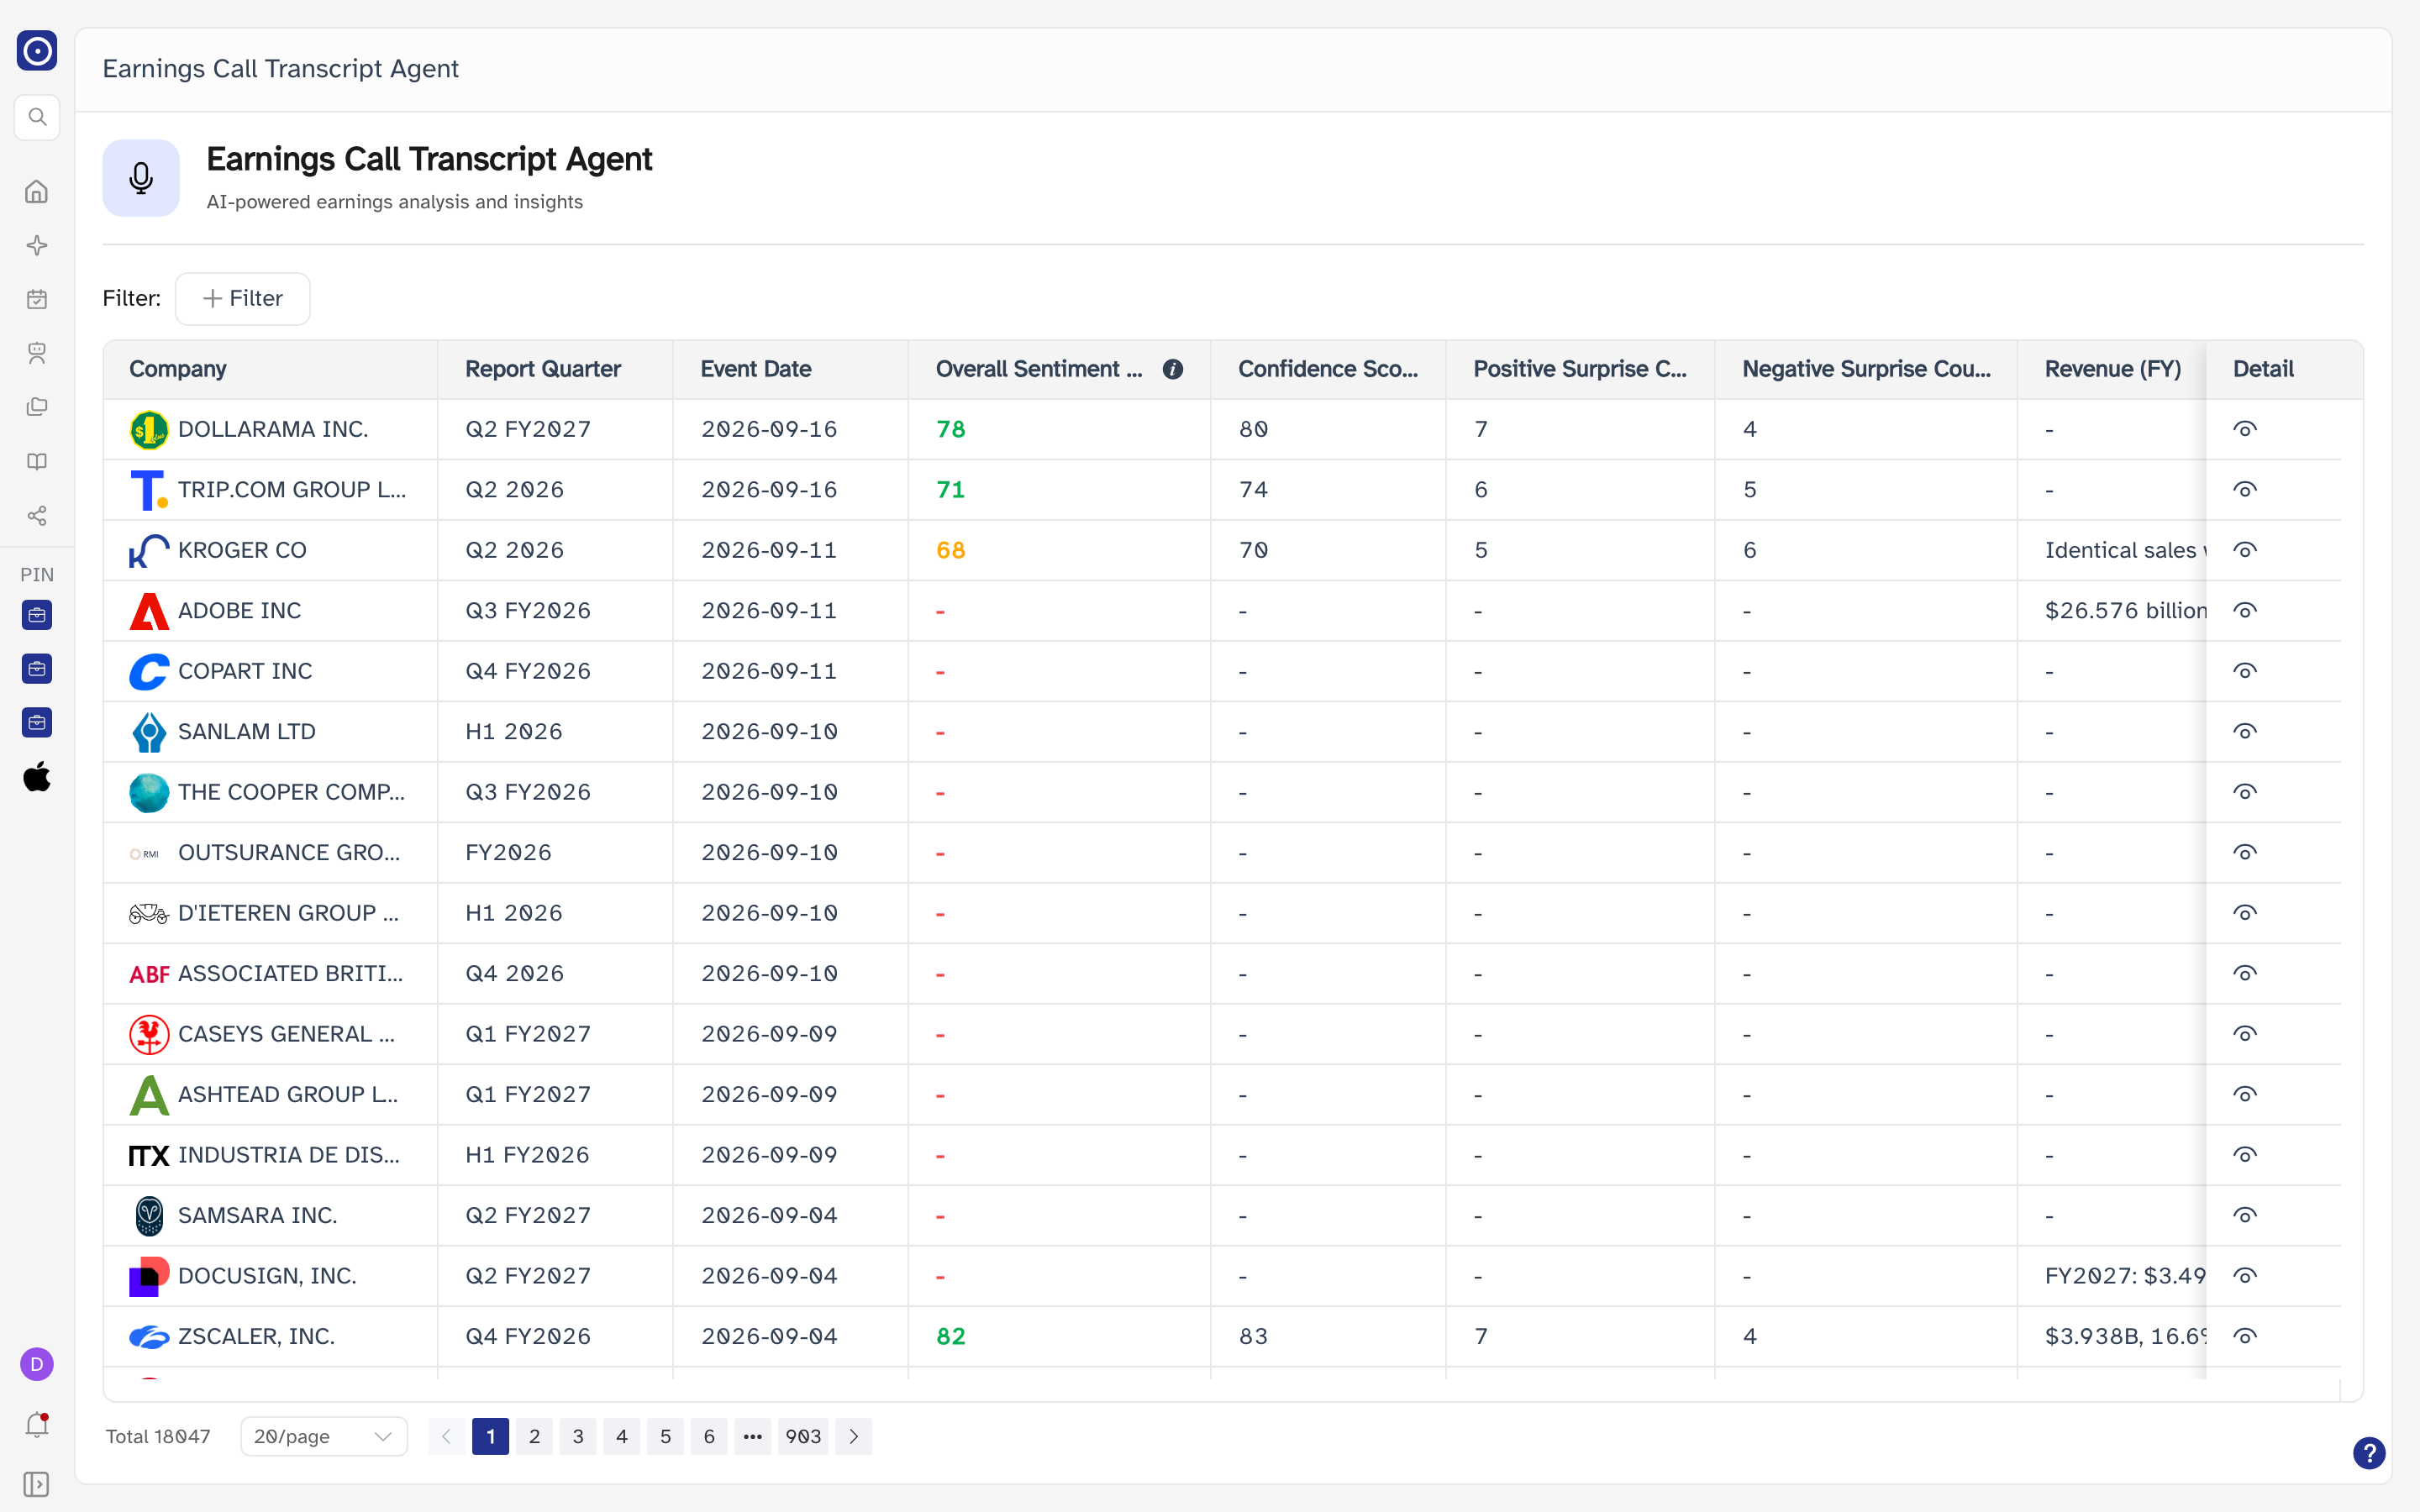
| Column | What it shows |
|---|---|
| Company | Logo and name. Clicking the icon at the far right opens the call. |
| Report Quarter | The quarter the call was reporting on, written as the company writes it — Q2 FY2027, H1 2026 and so on. Companies that do not use a quarterly calendar show a half year instead. |
| Event Date | The day the call took place. |
| Overall Sentiment Score | Orbit's score for the tone of the call, 0–100. The ⓘ beside the heading opens the bands it uses; see Reading the sentiment score below. |
| Confidence Score | How sure Orbit is of its reading of the call. |
| Positive Surprise Count | How many things management said landed better than the prior quarter. |
| Negative Surprise Count | How many landed worse. |
| Revenue (FY) | The revenue figure Orbit pulled out of the call, as management stated it. The wording varies with how the number was given, so it is not always a plain figure. |
| Operating Margin Pct | Operating margin for the period. |
| Outlook Direction | Whether guidance was raised, lowered or maintained, shown with an arrow. |
| Gross Margin Pct | Gross margin for the period. |
| Guidance Provided | Yes or No — whether the company gave forward guidance at all. A dash means the column has not been filled in. |
| Detail | The icon that opens the call. It stays pinned to the right-hand edge when you scroll the table sideways. |
A dash in any cell means Orbit did not find that figure in the call. Dashes are common on rows for companies that report only twice a year, or that took no questions.
Reading the sentiment score
The ⓘ beside Overall Sentiment Score opens the bands behind the number. The score is coloured to match: 70 and above is green, 50 to 69 amber, and below 50 red.
| Score | What it usually means |
|---|---|
| 90 – 100 | Exceptionally strong positive signal, historically rare. |
| 82 – 90 | Exceptionally strong quarter — record results, a significant beat. |
| 74 – 82 | A solid beat above expectations. |
| 62 – 72 | In line with expectations, a steady quarter. |
| 50 – 62 | Cautious tone, notable hedging language. |
| 40 – 50 | Neutral to weak; cautionary signals worth attention. |
| 25 – 39 | Clearly under pressure — defensive language, or negative information clustered together. |
| 0 – 24 | Severely negative, major risk exposure. |
The colour thresholds sit at 70 and 50, while the bands change at 74, 62, 60 and 50. A call scoring 72 is therefore amber even though the table above calls it a steady quarter, and one scoring 68 is amber while the band below it starts at 62. Read the number, not the colour.
Filtering the list
Filter narrows the list to the companies you care about. It holds two filters, and unlike most filters in Orbit neither starts with a value — the page opens showing everything.
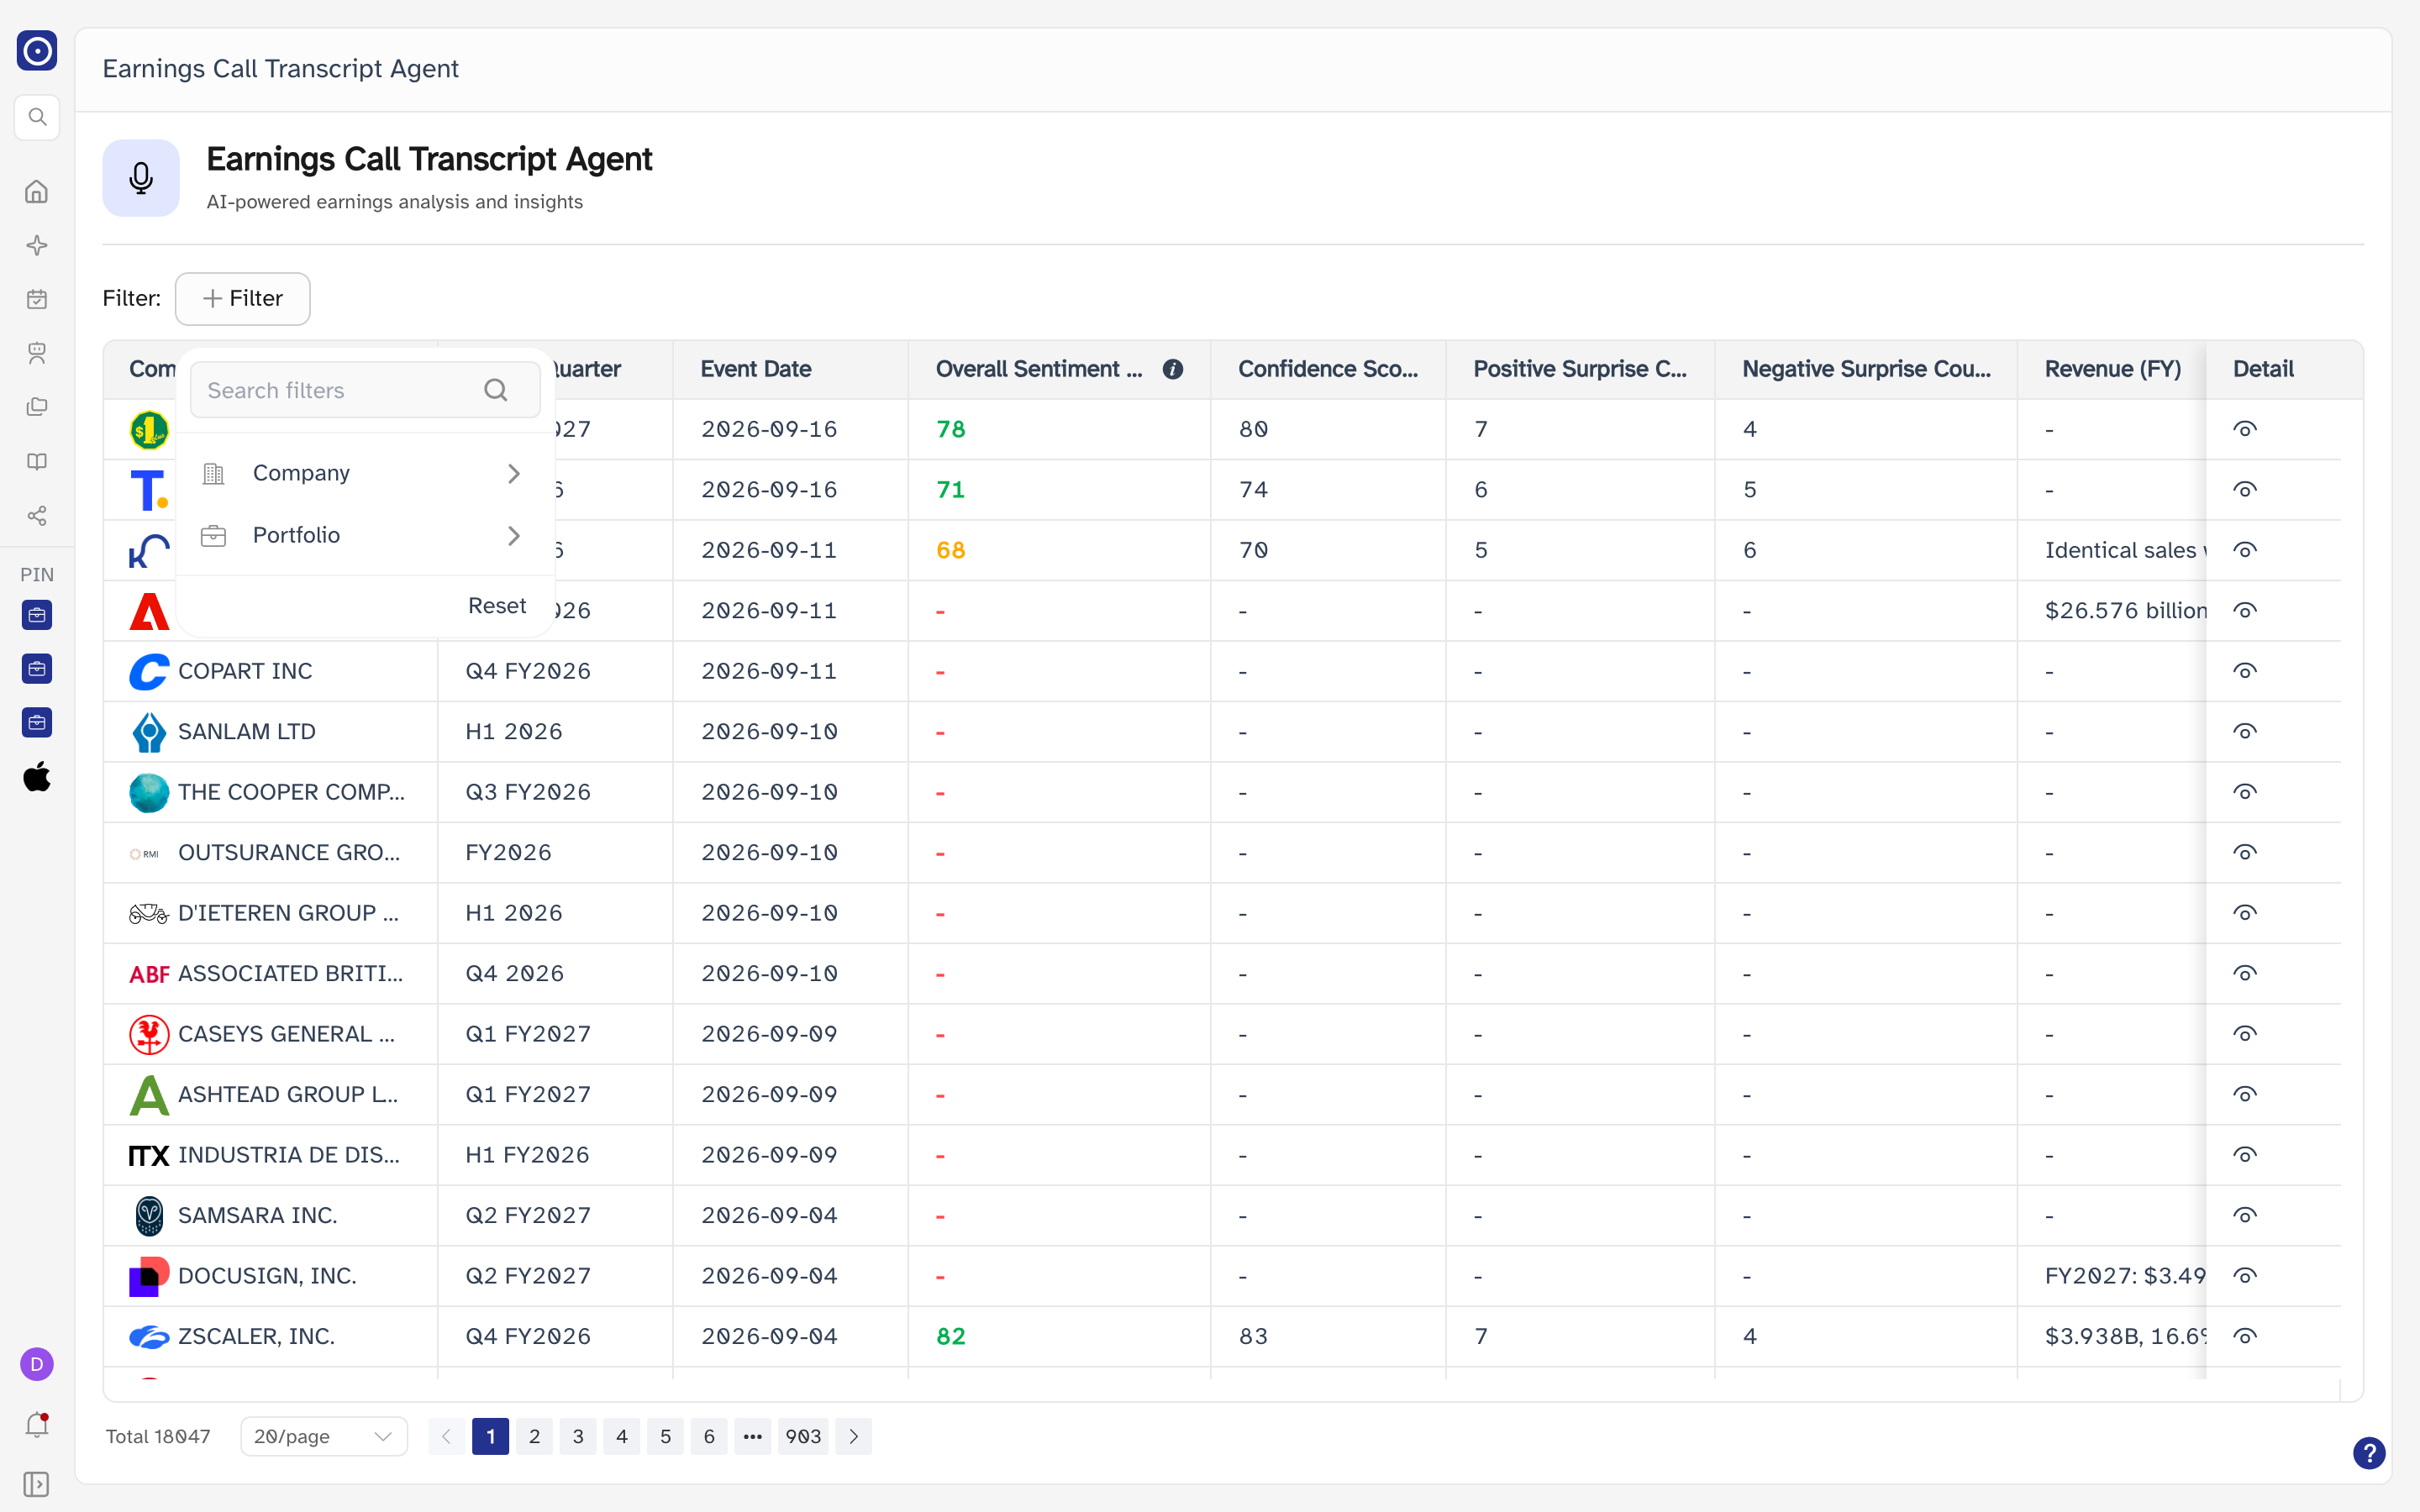
Company
The list under Company is a short preview. Typing in Search here searches every company in Orbit instead and returns the closest three matches, so you do not have to scroll through the whole universe to find one.
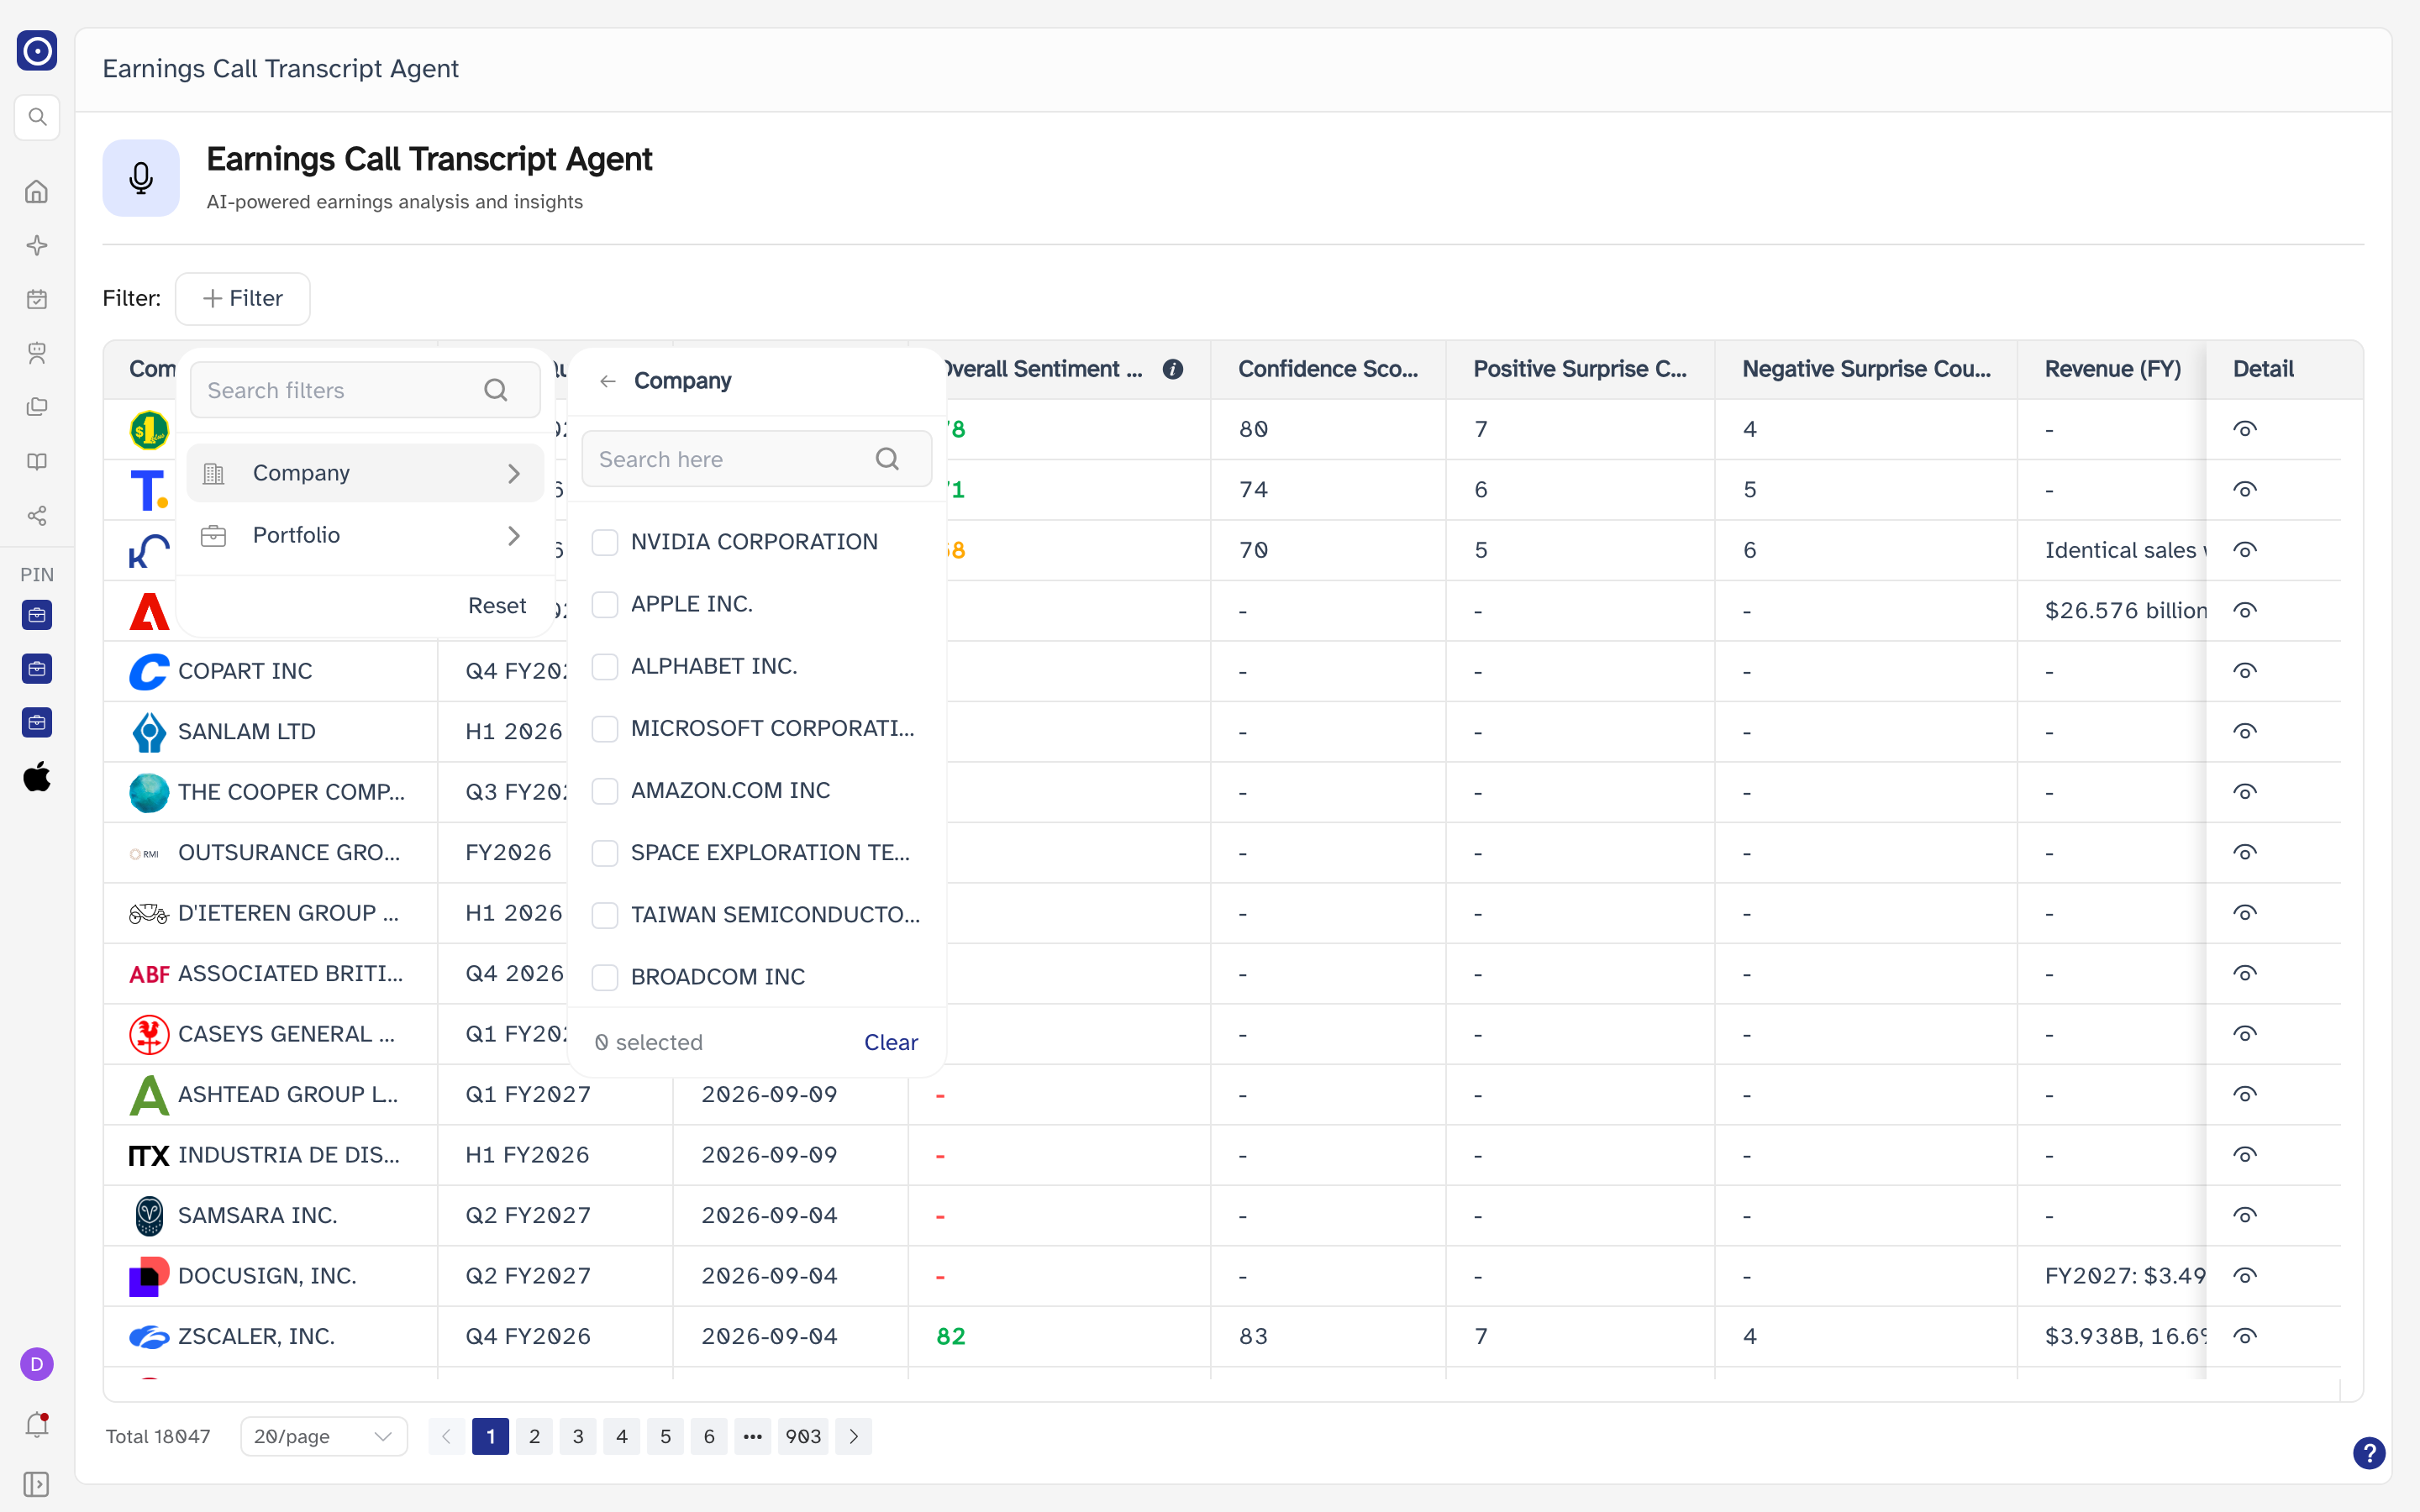
Portfolio
Portfolio lists every portfolio you can see, so filtering this way keeps the list in step with a set of companies you already maintain rather than a set you pick here.
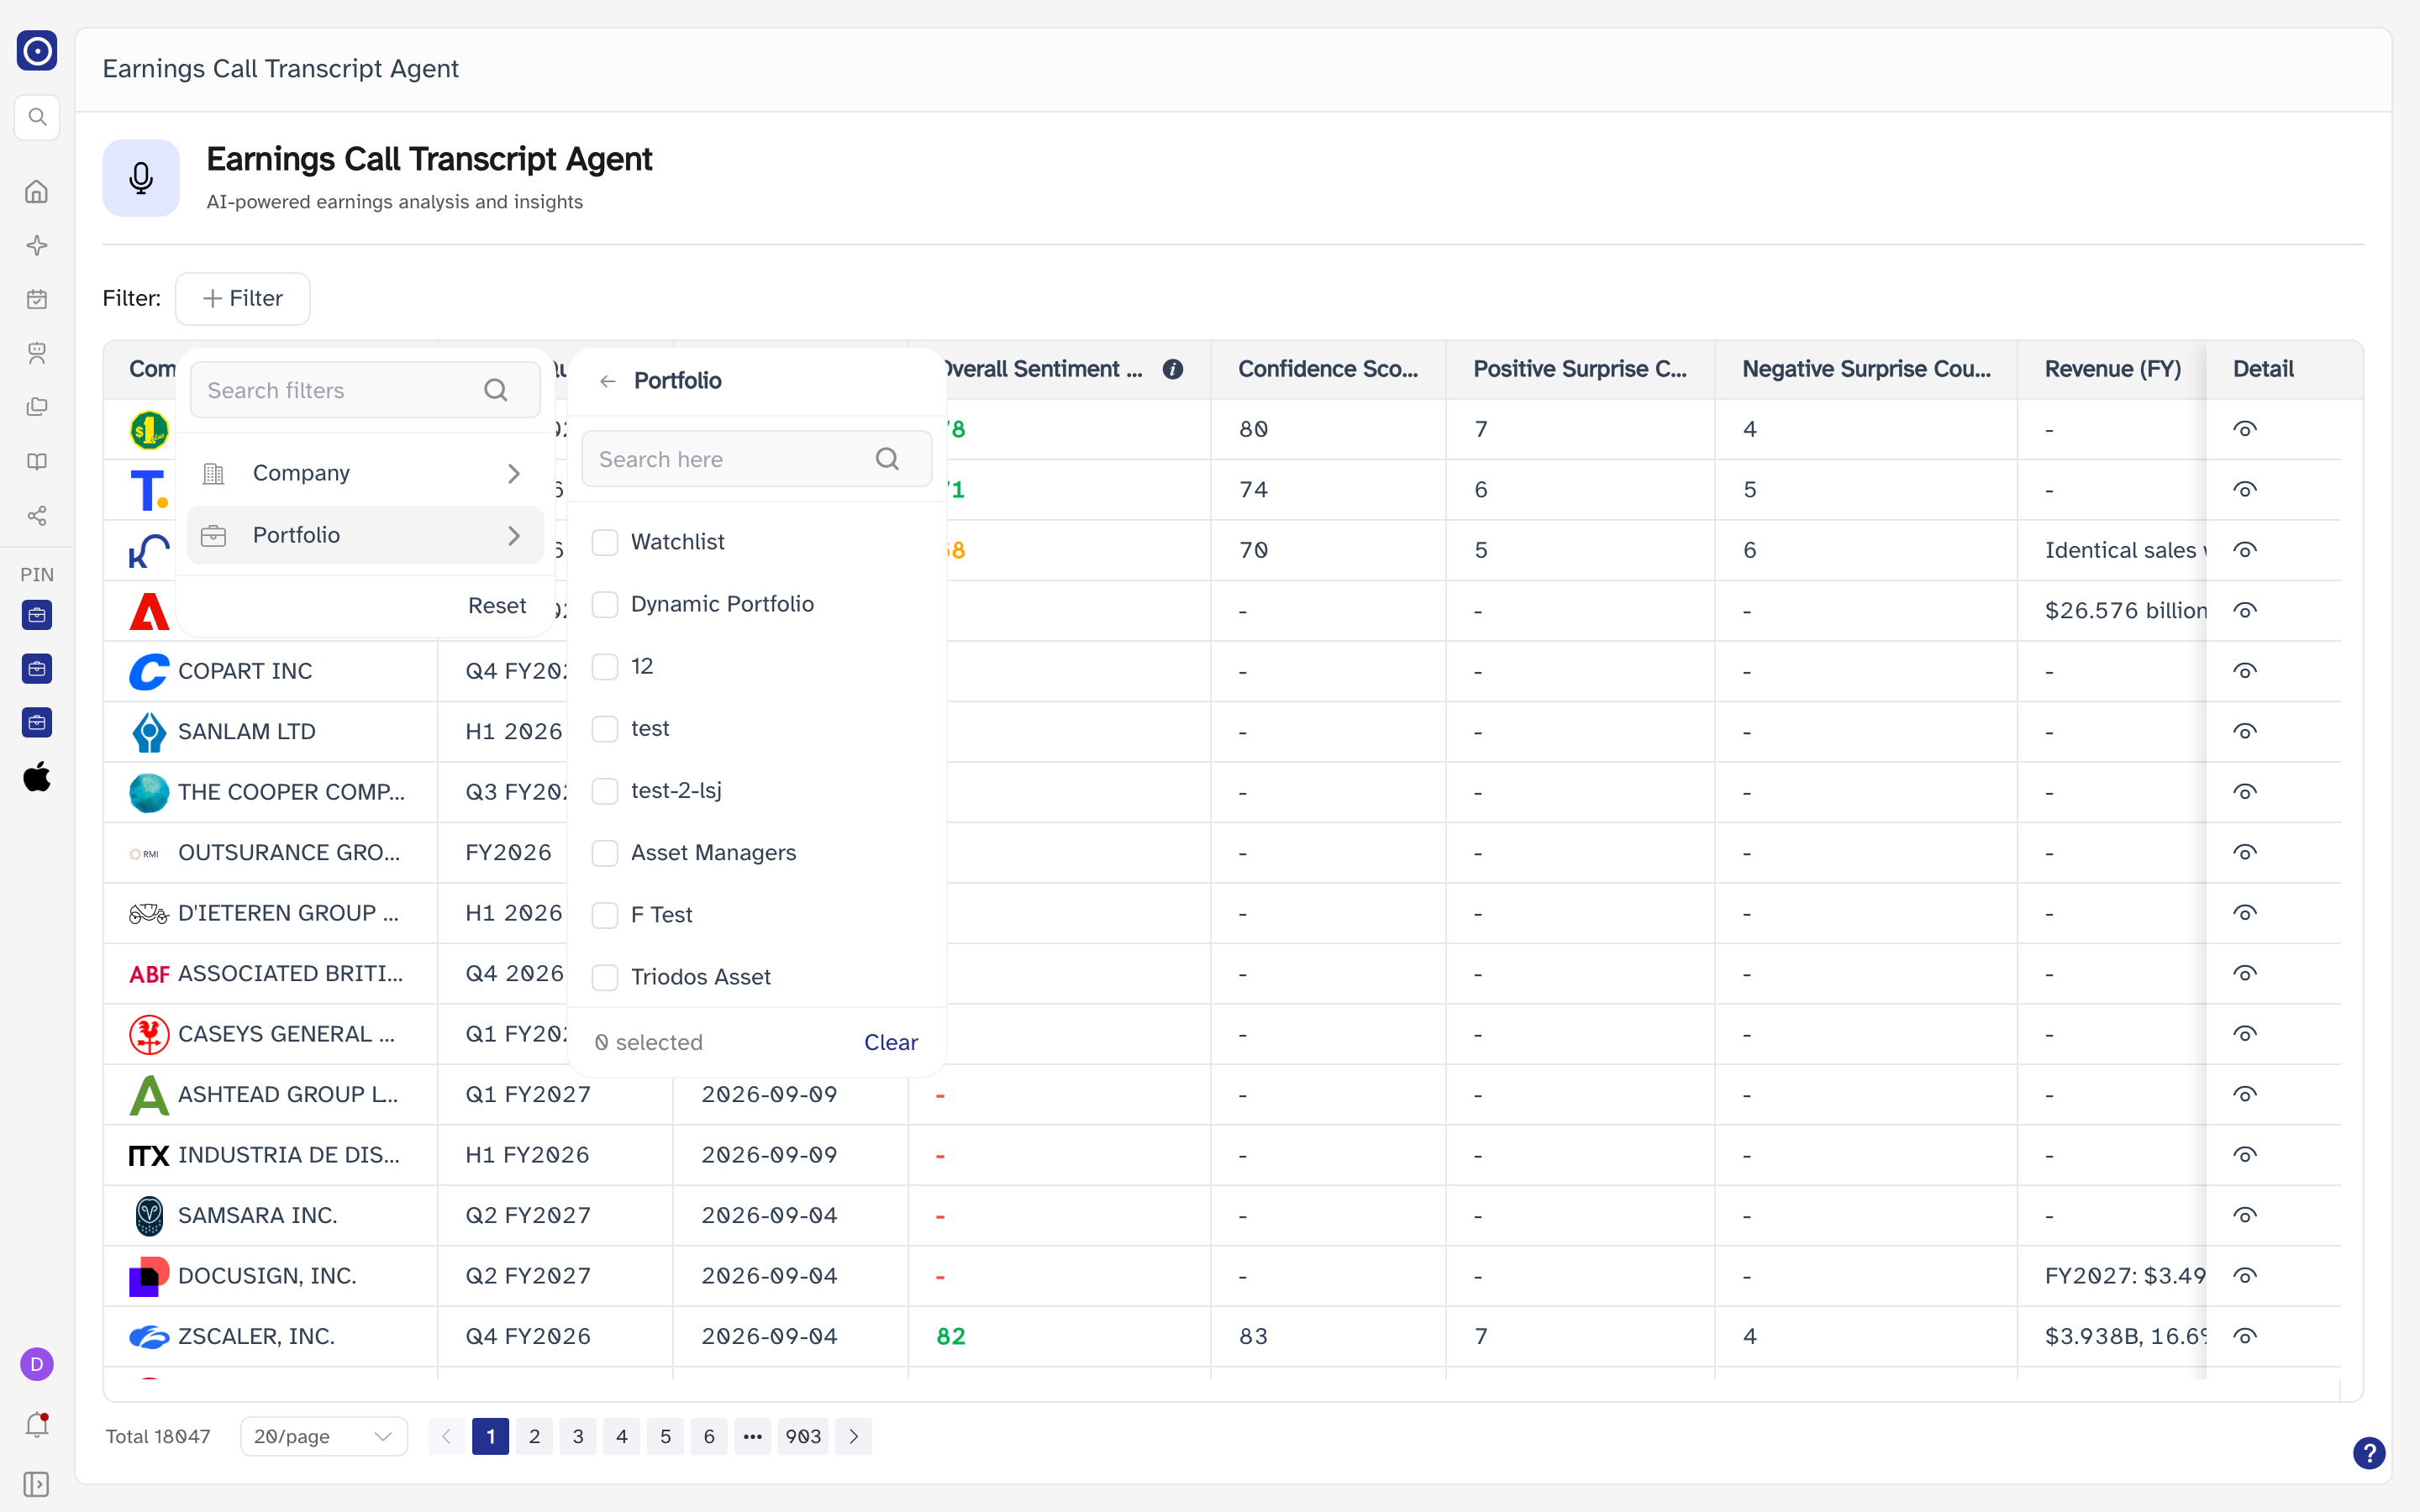
Changing either filter reloads the list and returns you to page 1.
The call itself
Clicking a row opens the write-up. The top of the page identifies the company — its tickers, ISIN, market cap, legal entity identifier, incorporation date, domicile and website — so you can tell at a glance that you are on the right entity before reading anything.
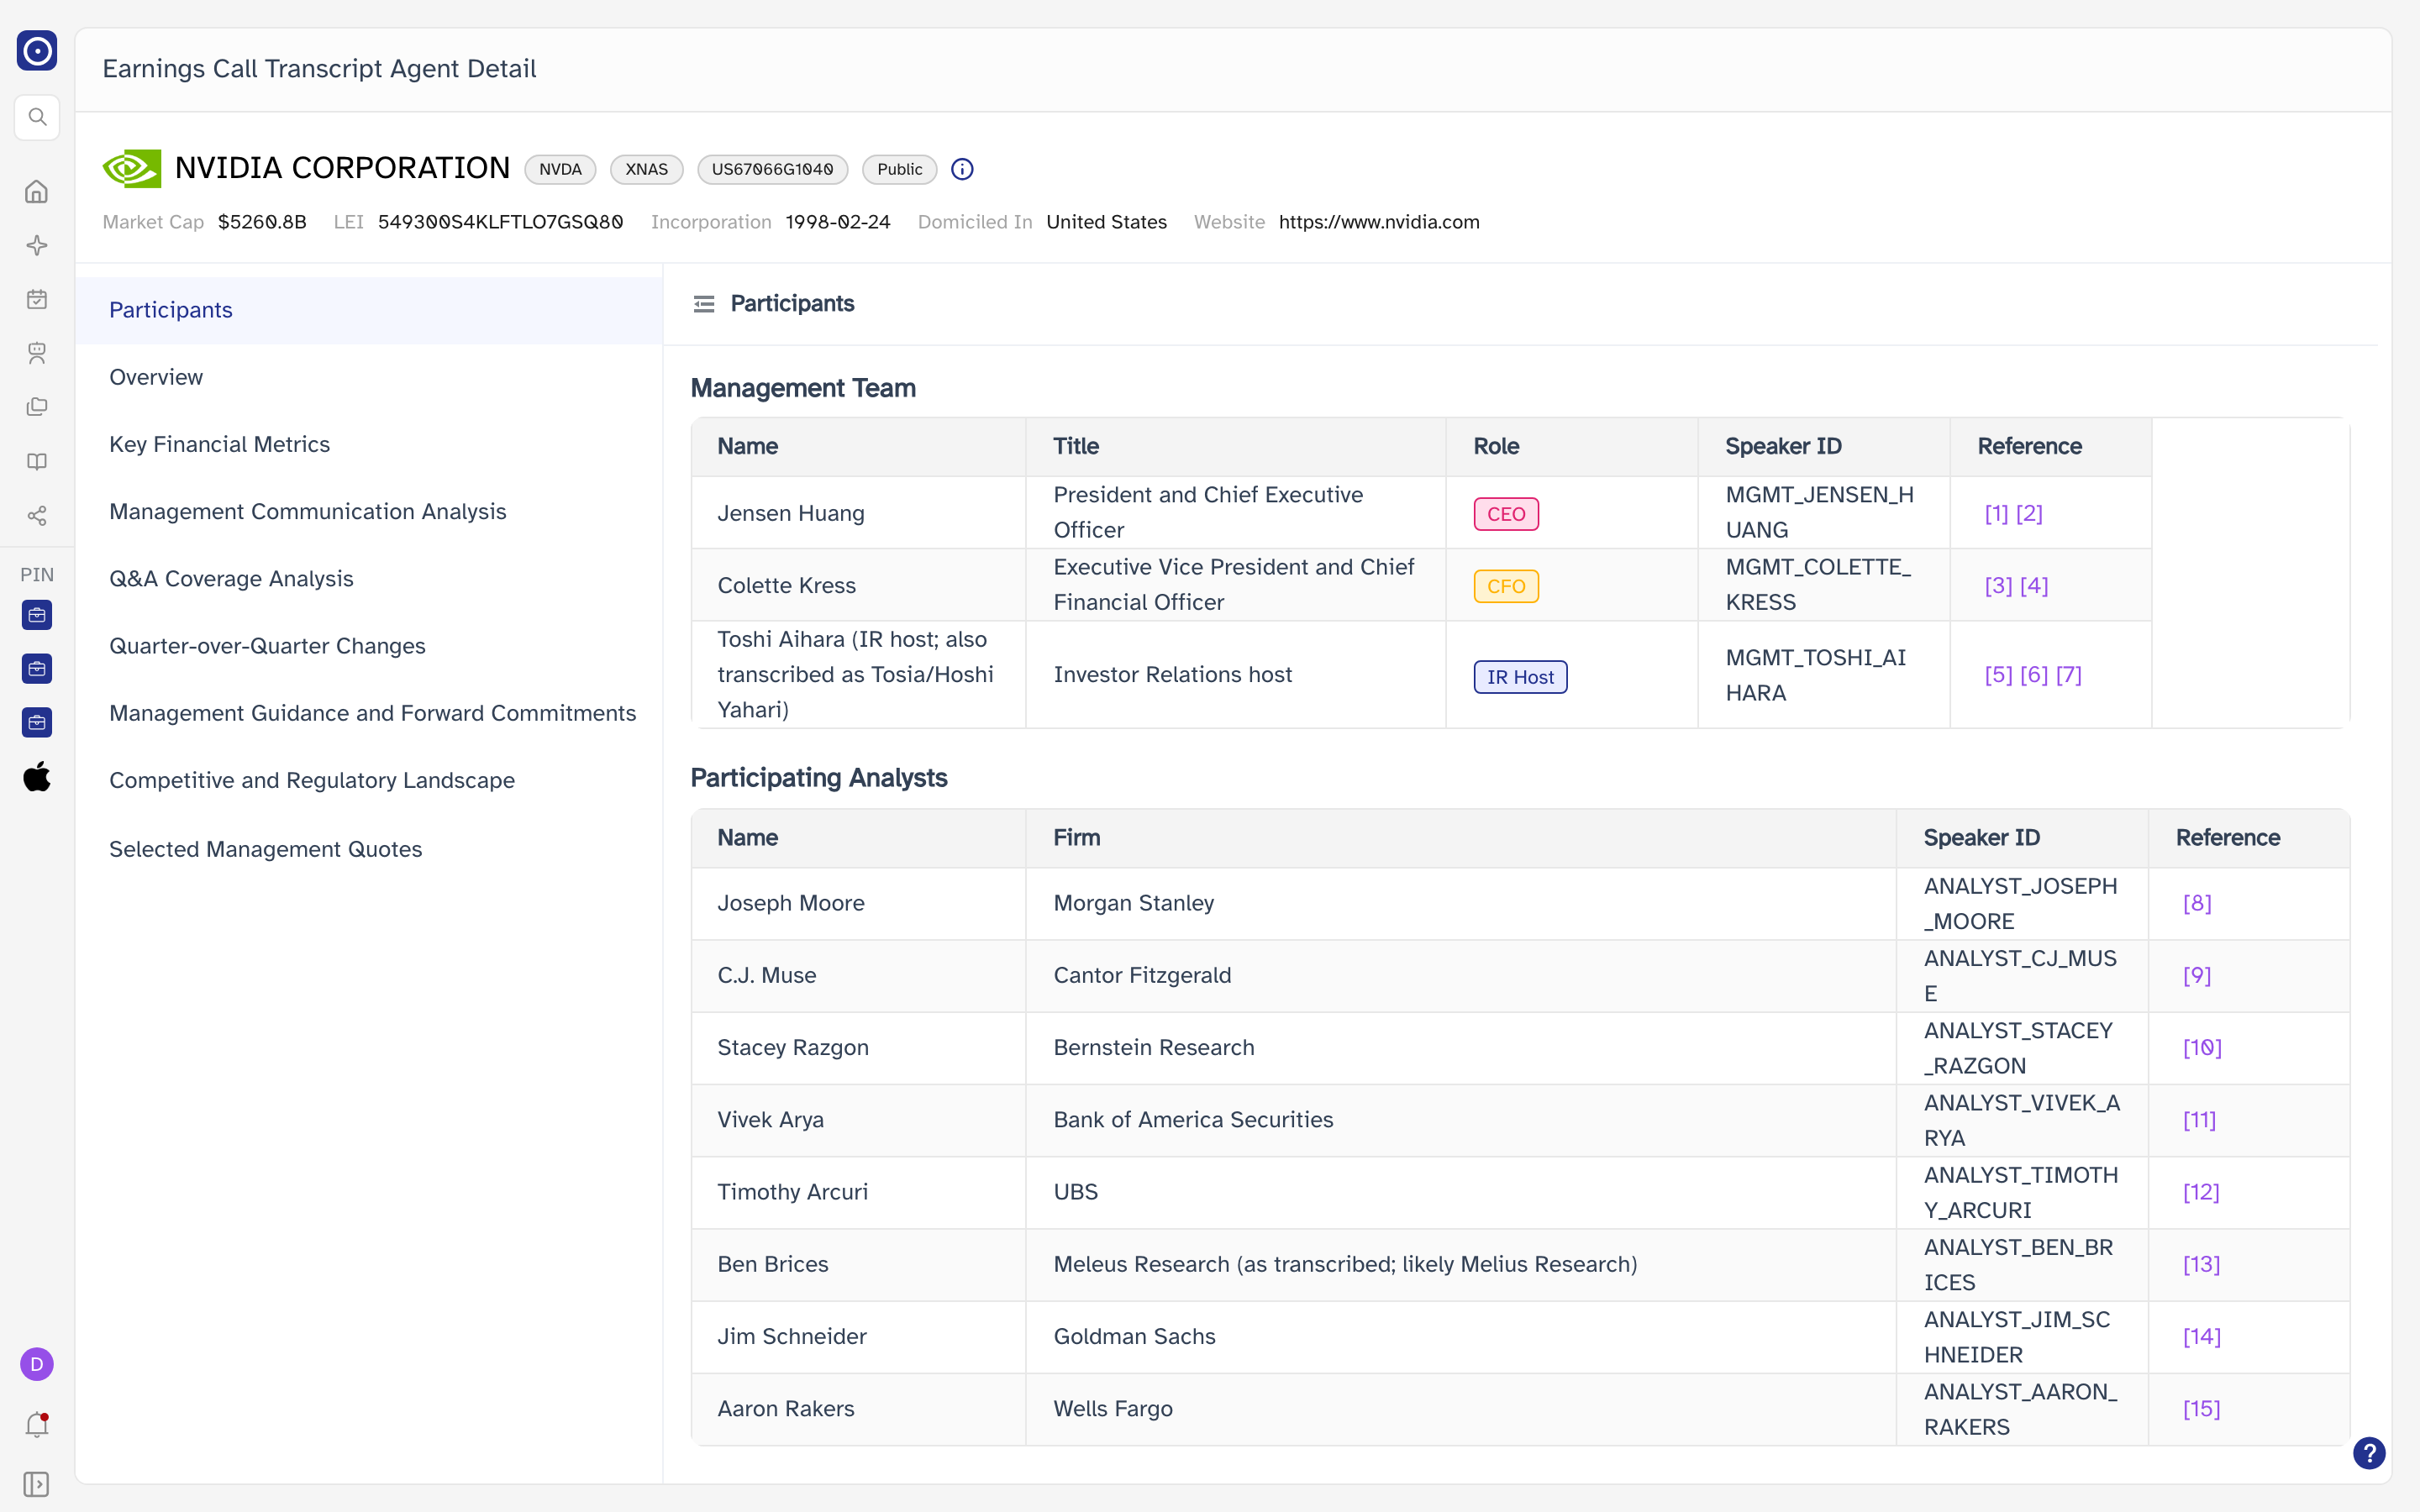
| In the header | What it is |
|---|---|
| Ticker badges | The exchange symbols the company trades under. A company listed in several places shows several. |
| ISIN | The security identifier, shown in full rather than abbreviated. |
| Public | The entity is a listed company. Private entities are marked differently. |
| ⓘ | Opens Orbit's description of the entity. |
| Market Cap | Market capitalisation in USD. |
| LEI | The company's Legal Entity Identifier — the code used to identify it unambiguously in regulatory filings. |
| Incorporation | The date the company was incorporated. |
| Domiciled In | The country the company is domiciled in. |
| Website | The company's own site. |
The section menu
The write-up is split into nine sections, listed down the left in reading order. Clicking one swaps the right-hand pane. The toolbar icon above the section name collapses the menu to give the text the full width — click it again to bring the menu back.
| Section | What it covers |
|---|---|
| Participants | Who was on the call: management with their titles and roles, and the analysts who asked questions with their firms. |
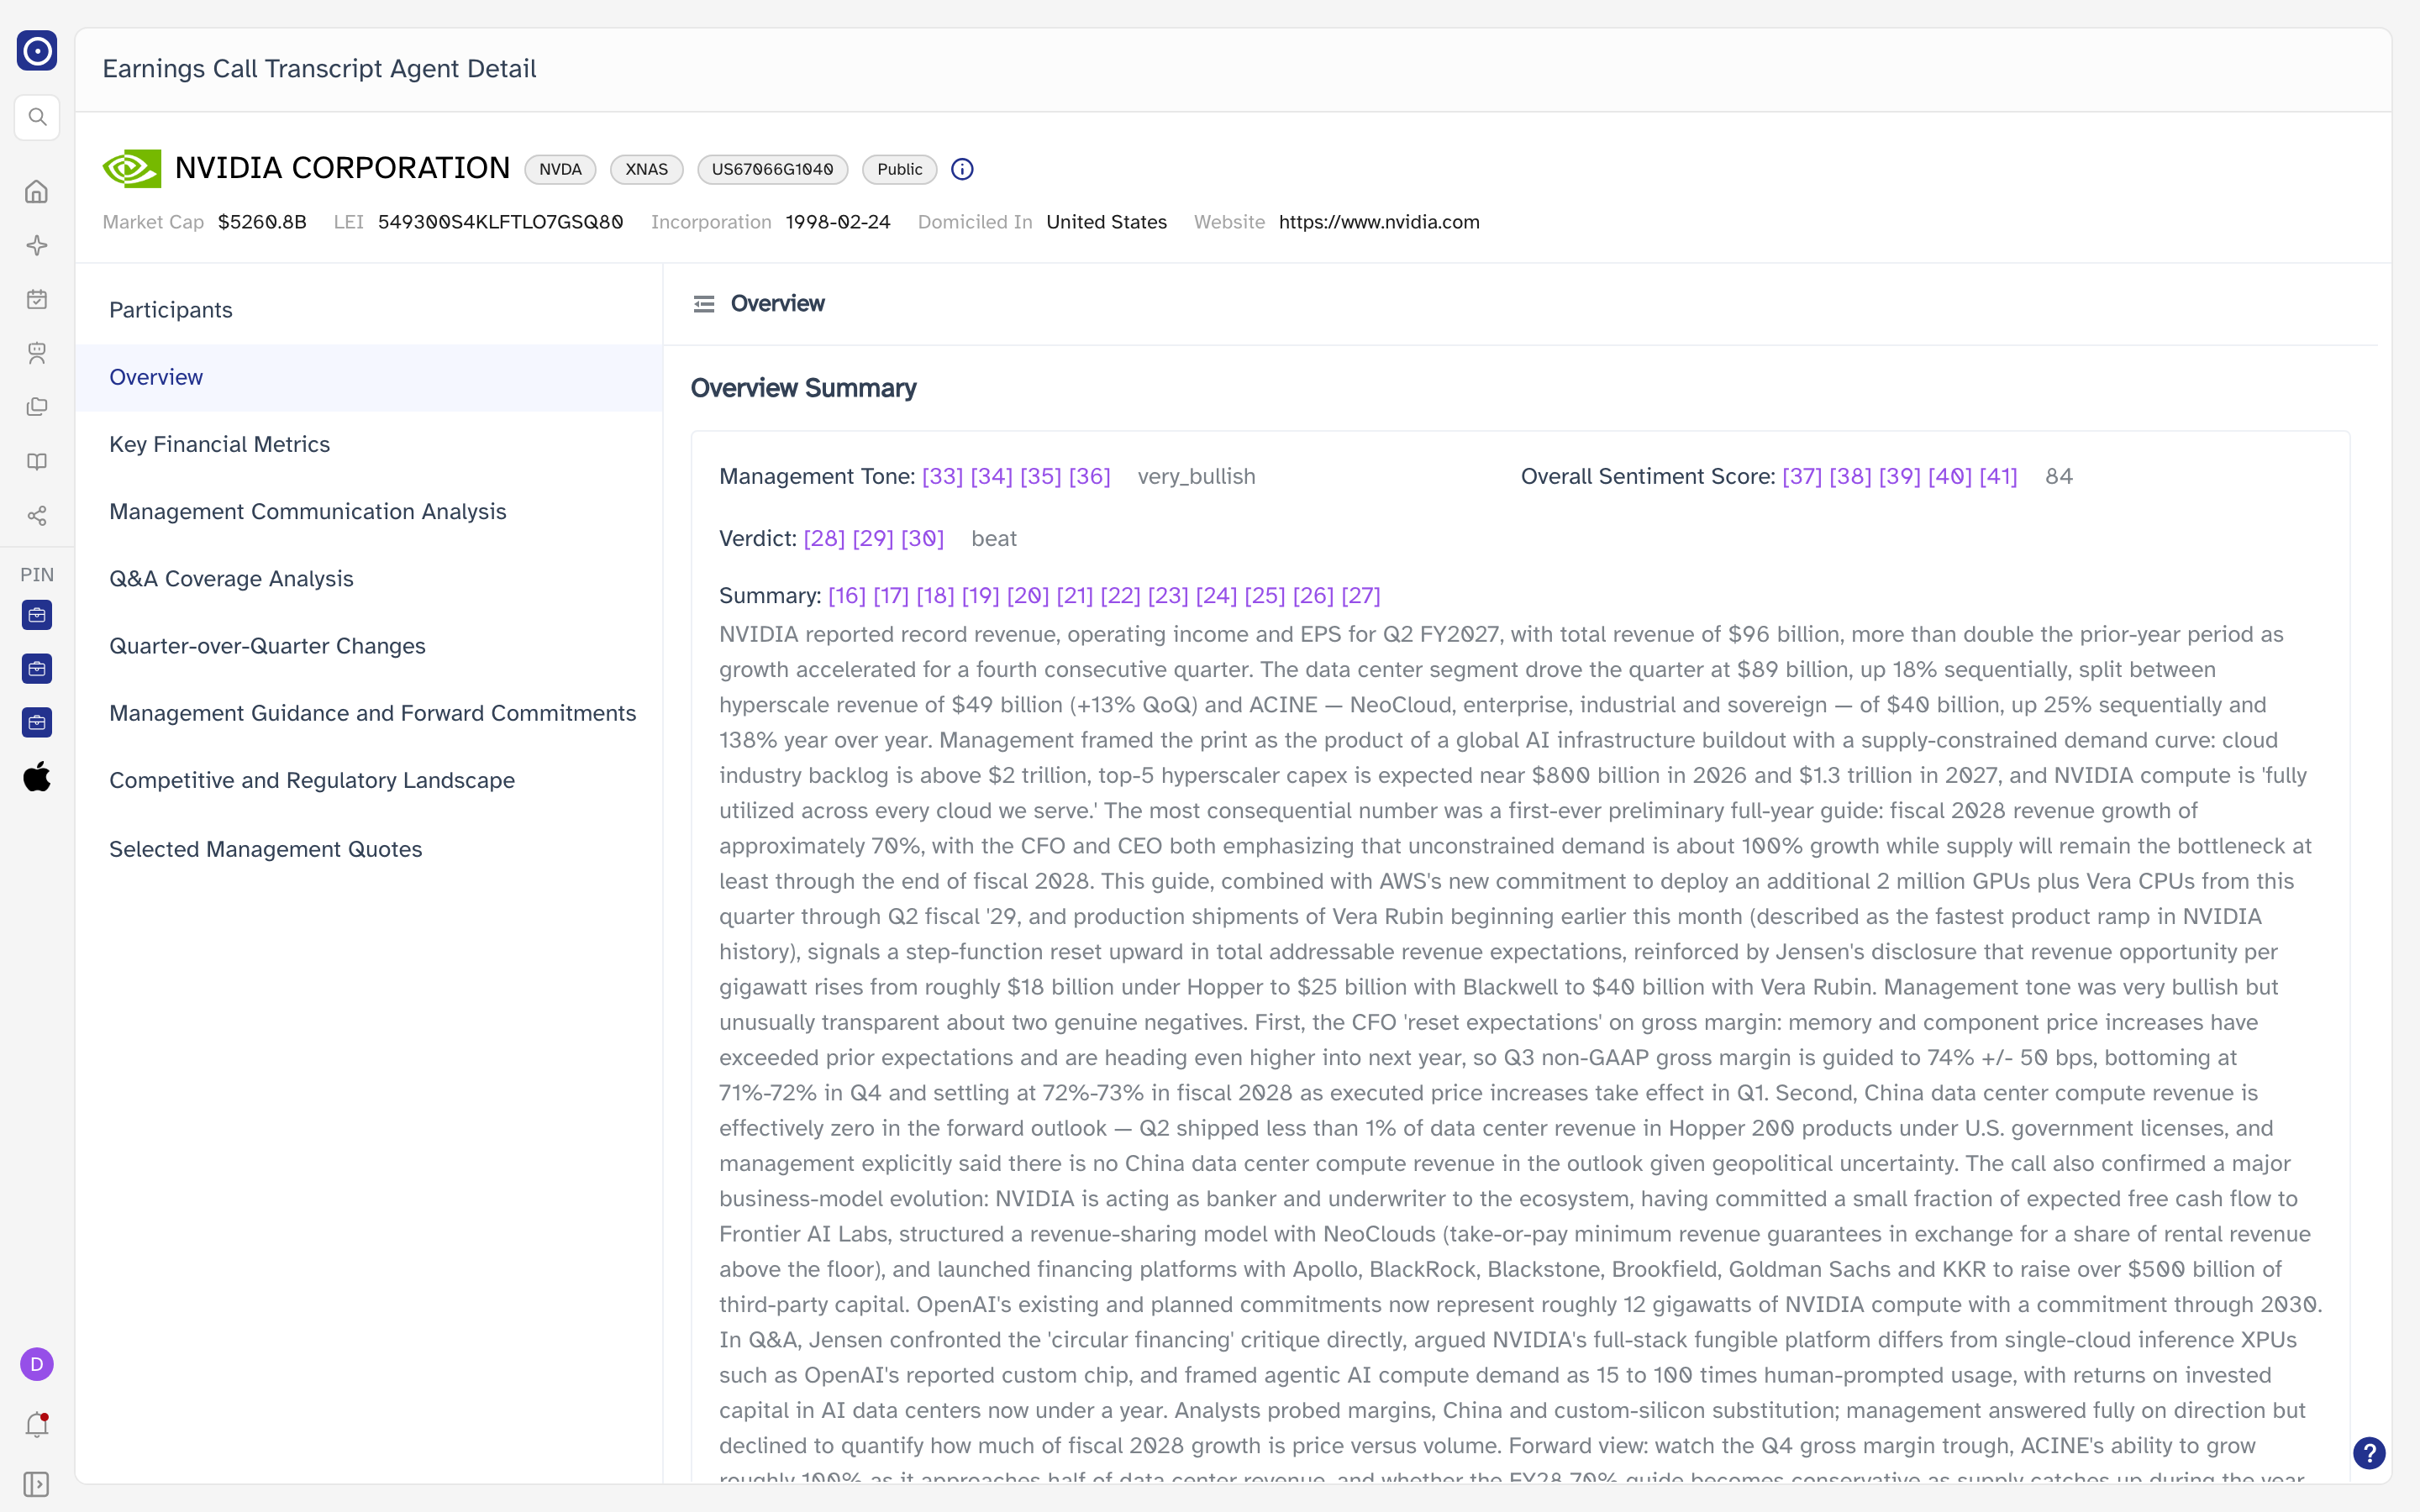
| Overview | The short version — tone, sentiment, whether the quarter beat or missed, and a written summary. |
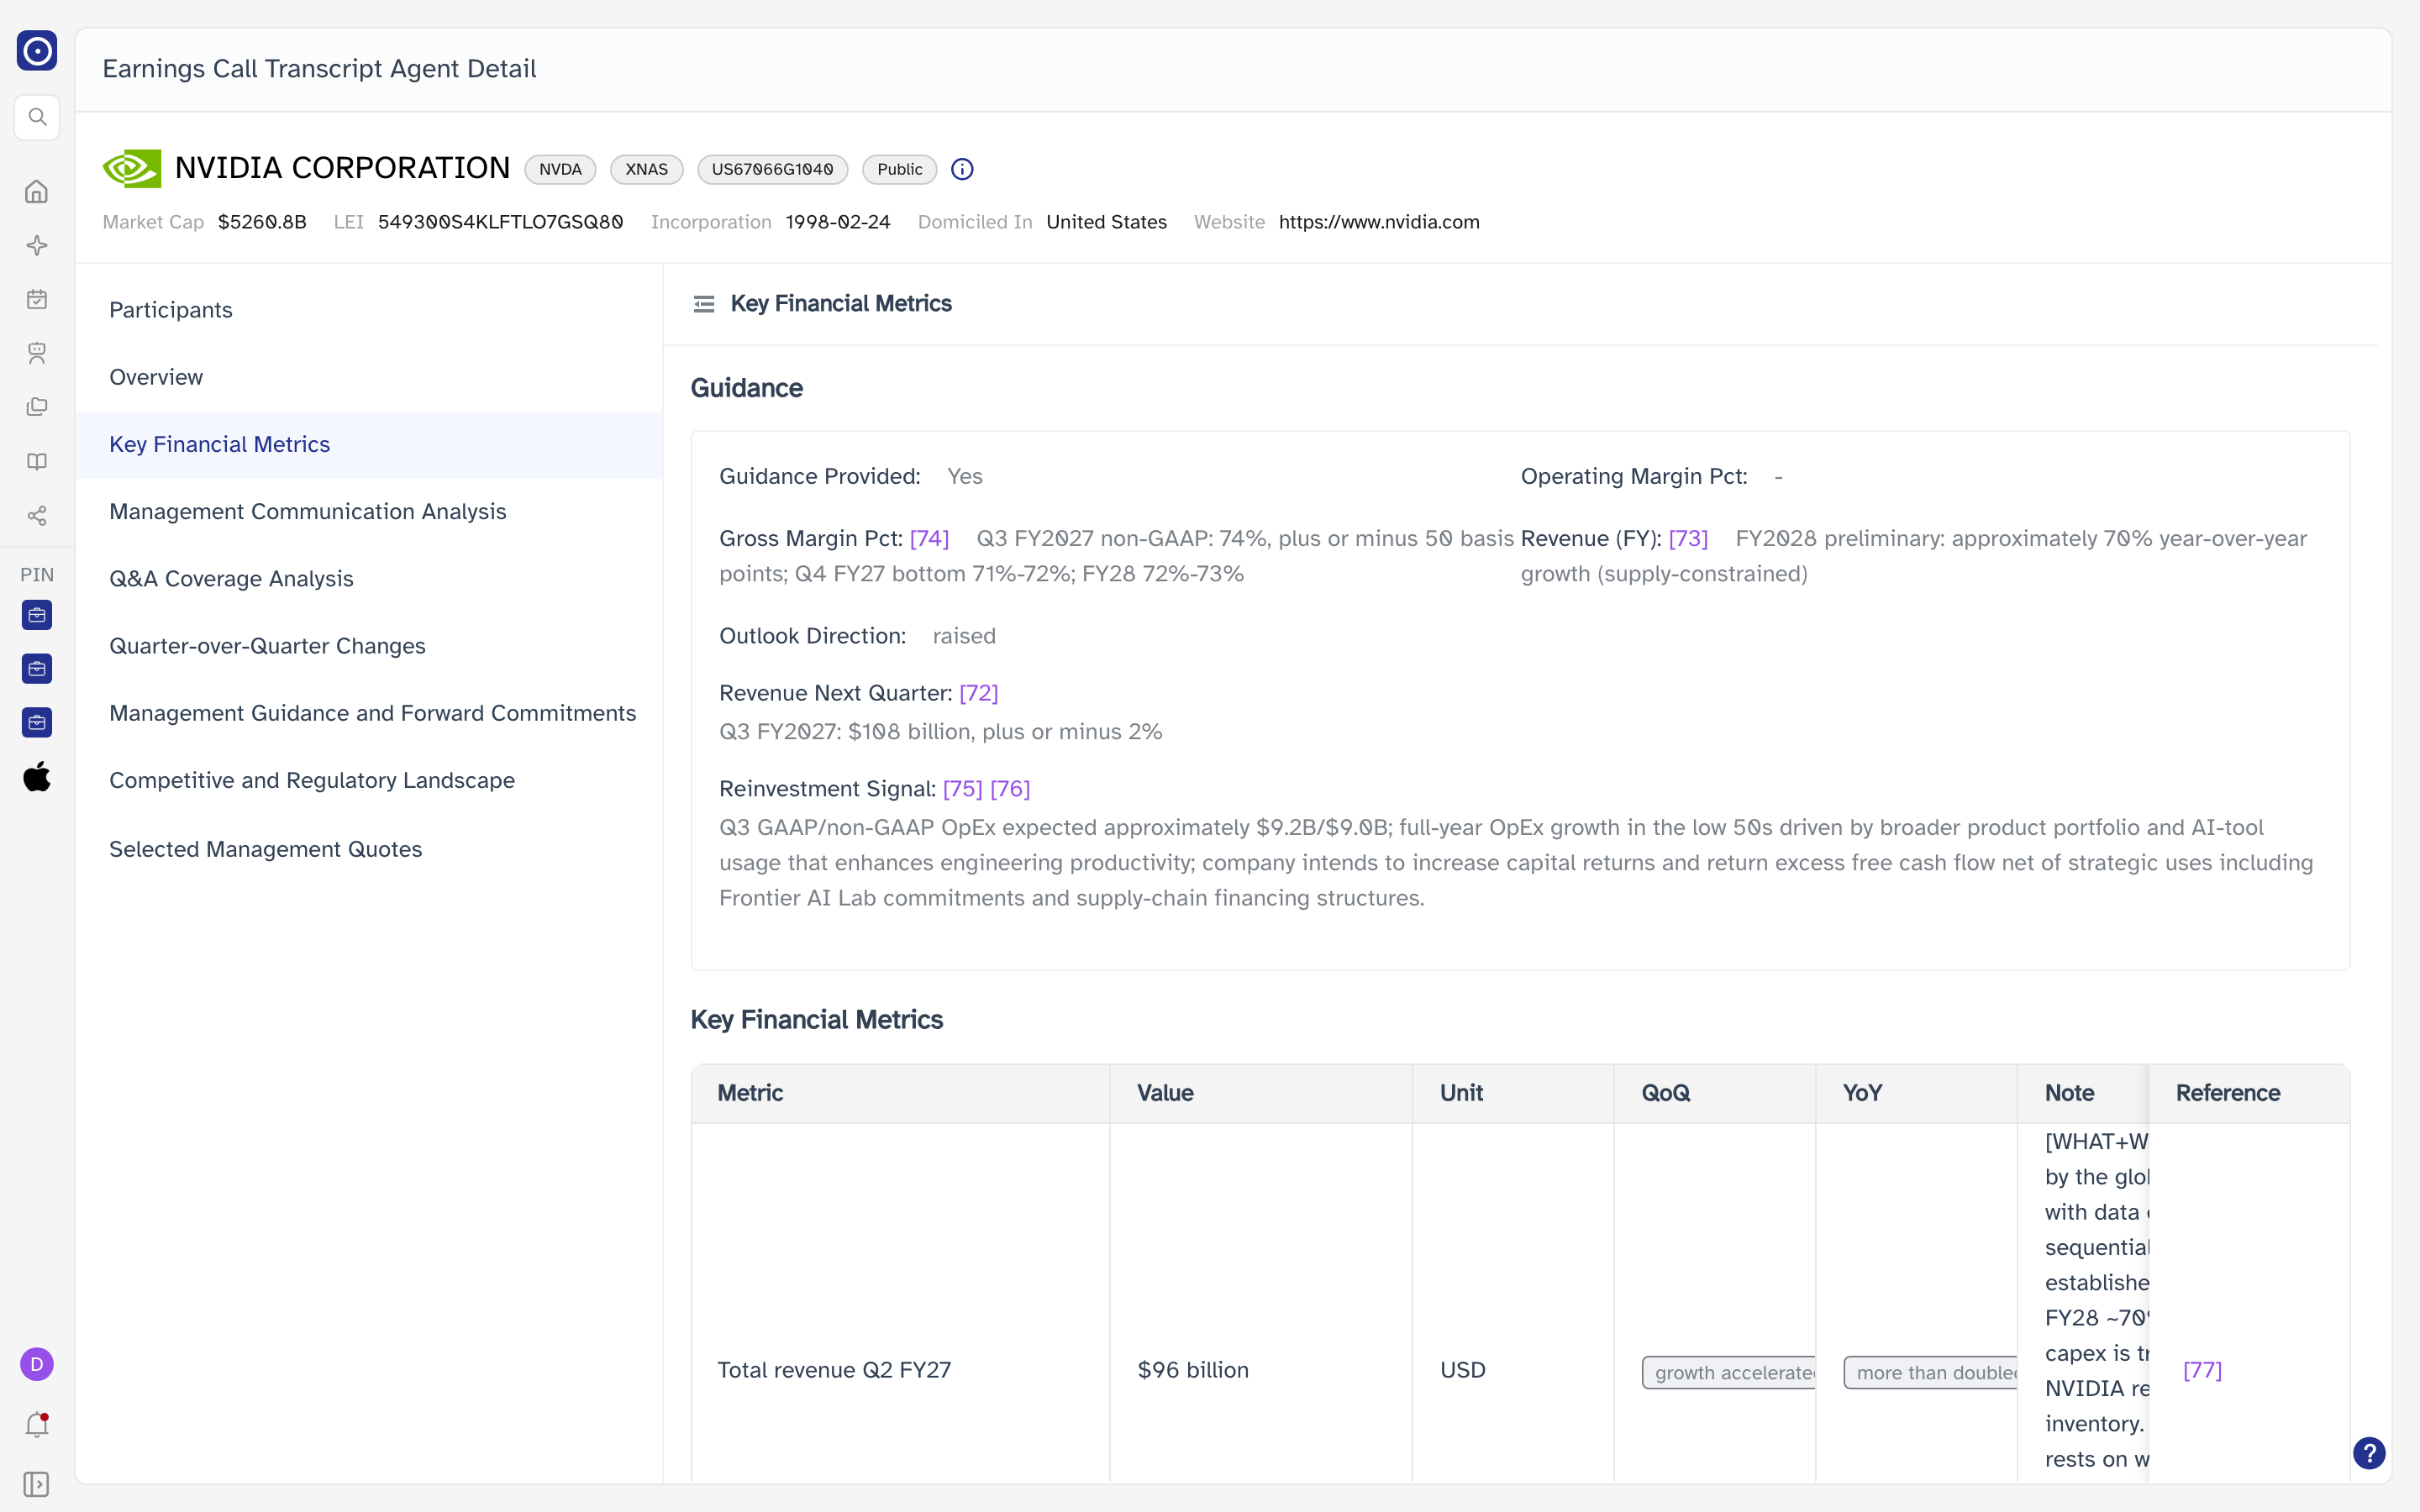
| Key Financial Metrics | What the company guided for, and a table of the figures discussed with their quarter-on-quarter and year-on-year movement. |
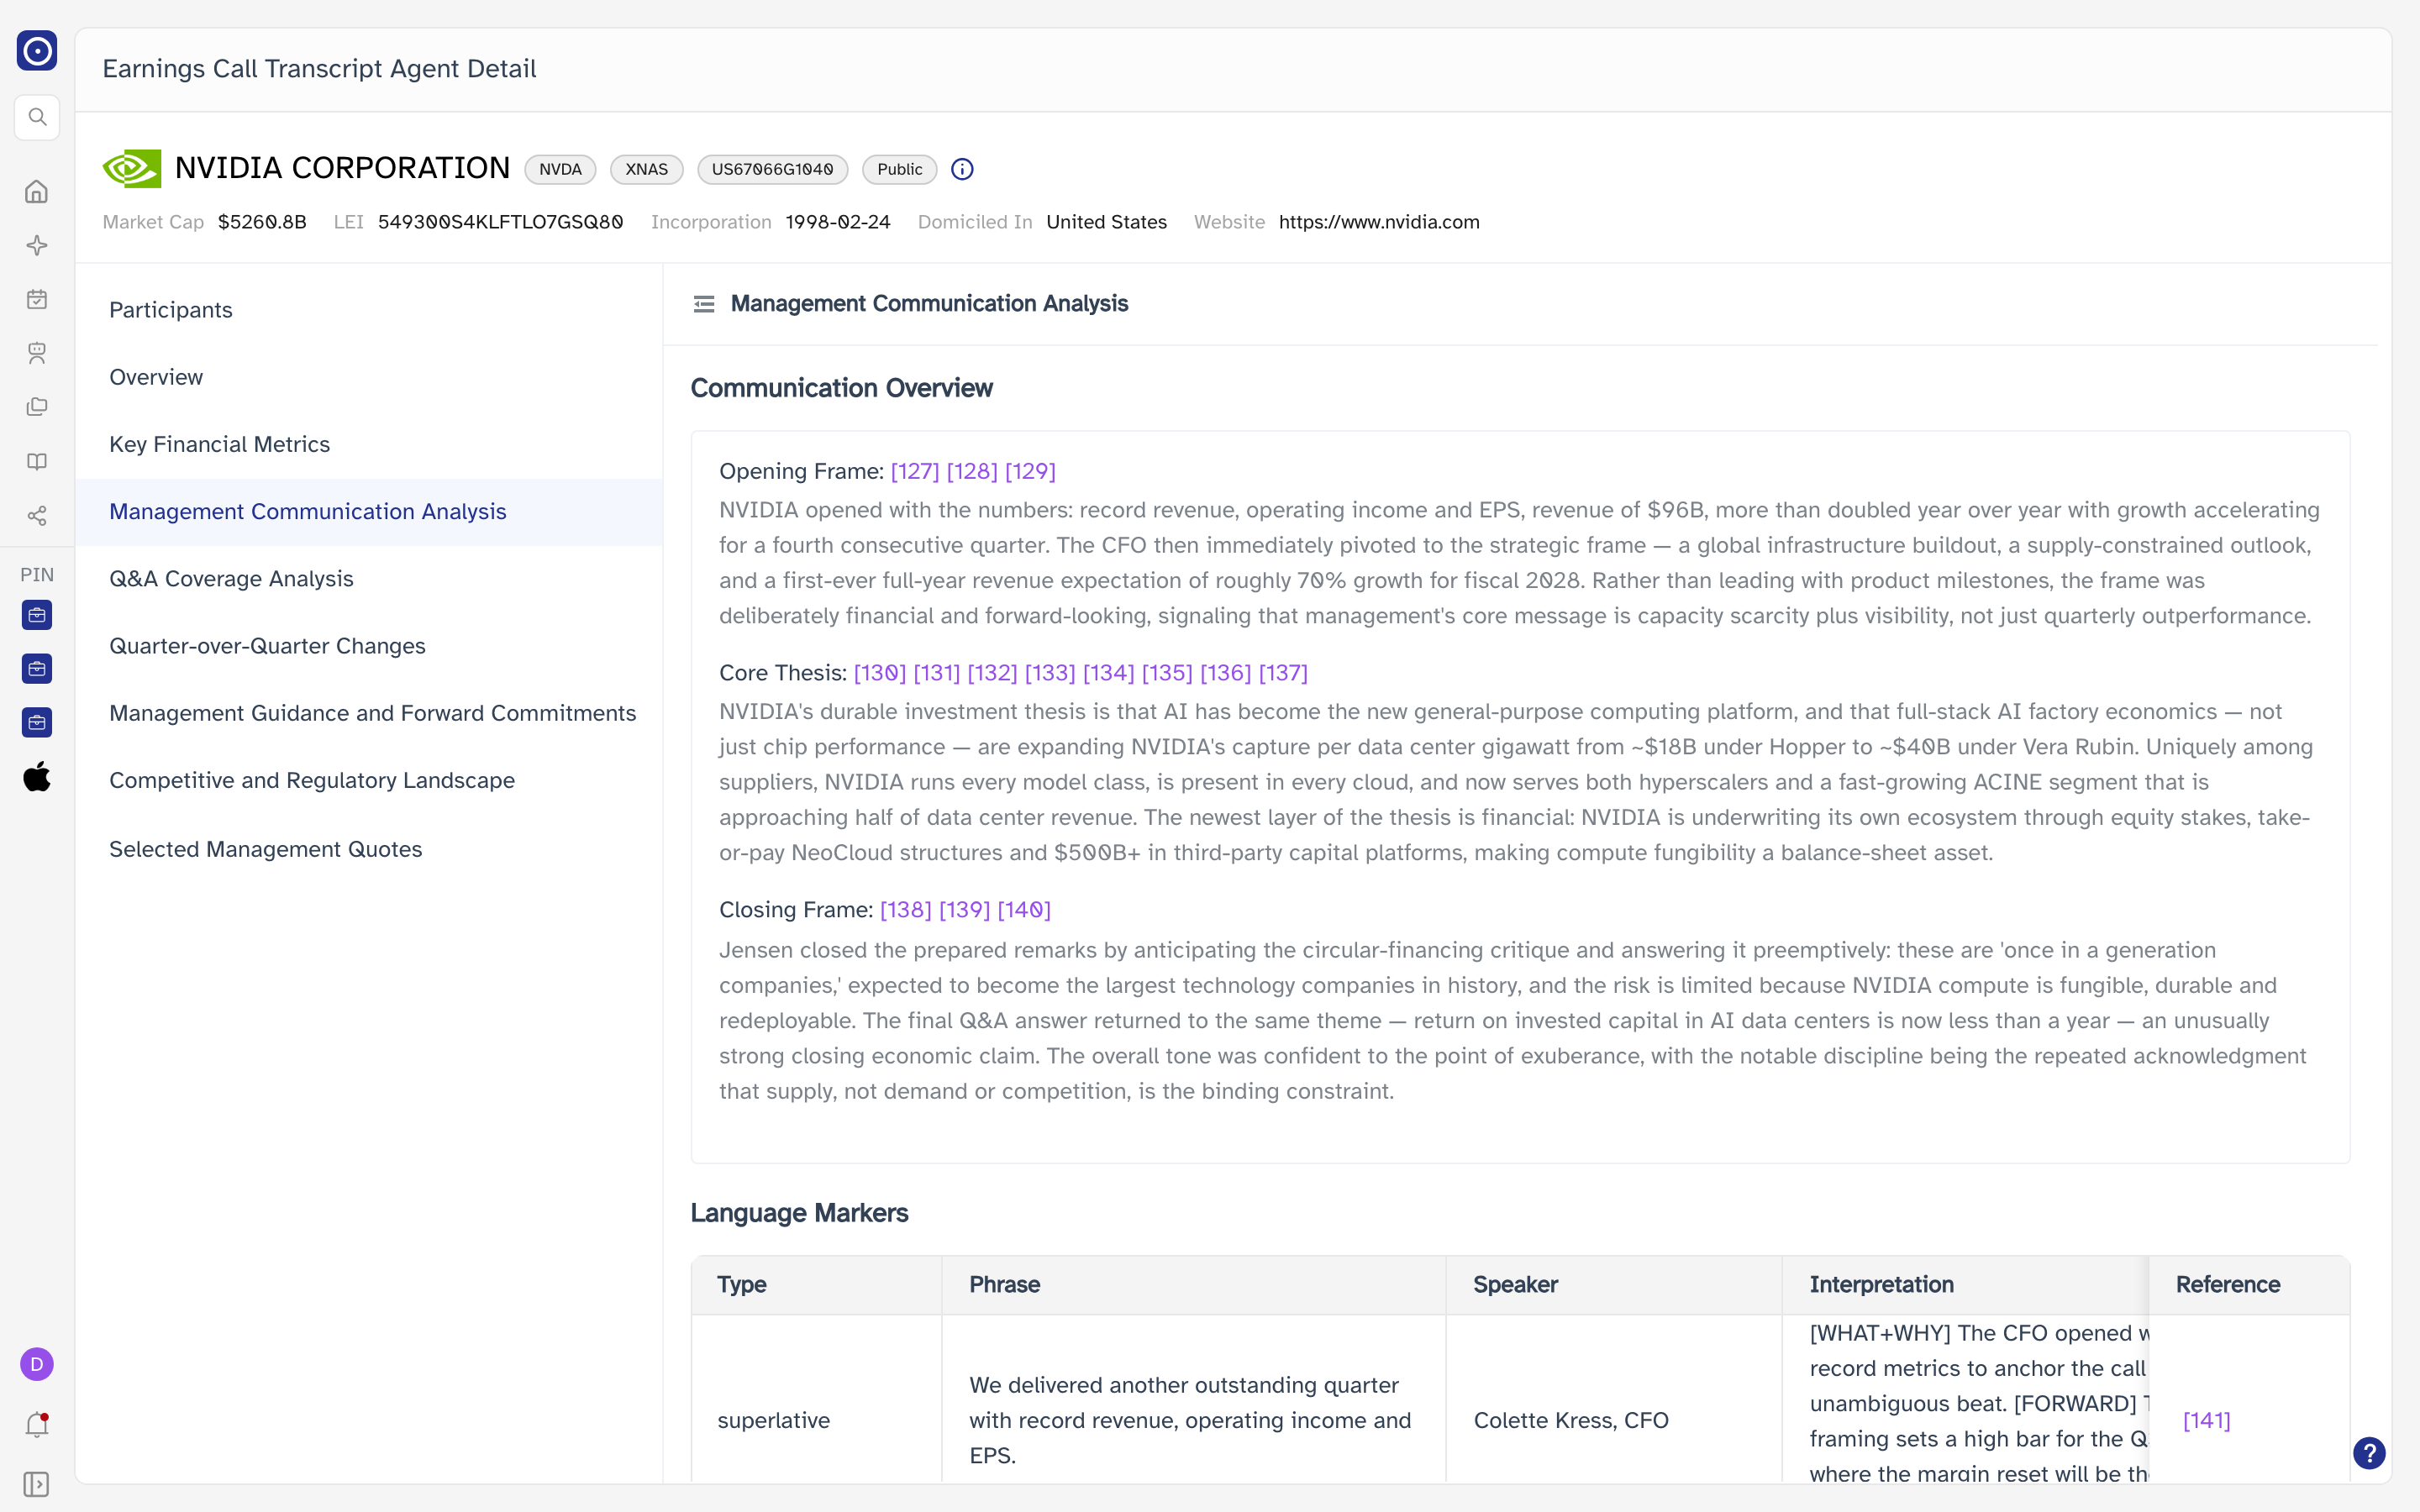
| Management Communication Analysis | How management framed the quarter — how they opened, what they argued, how they closed — plus a table of pointed phrases and what they were doing. |
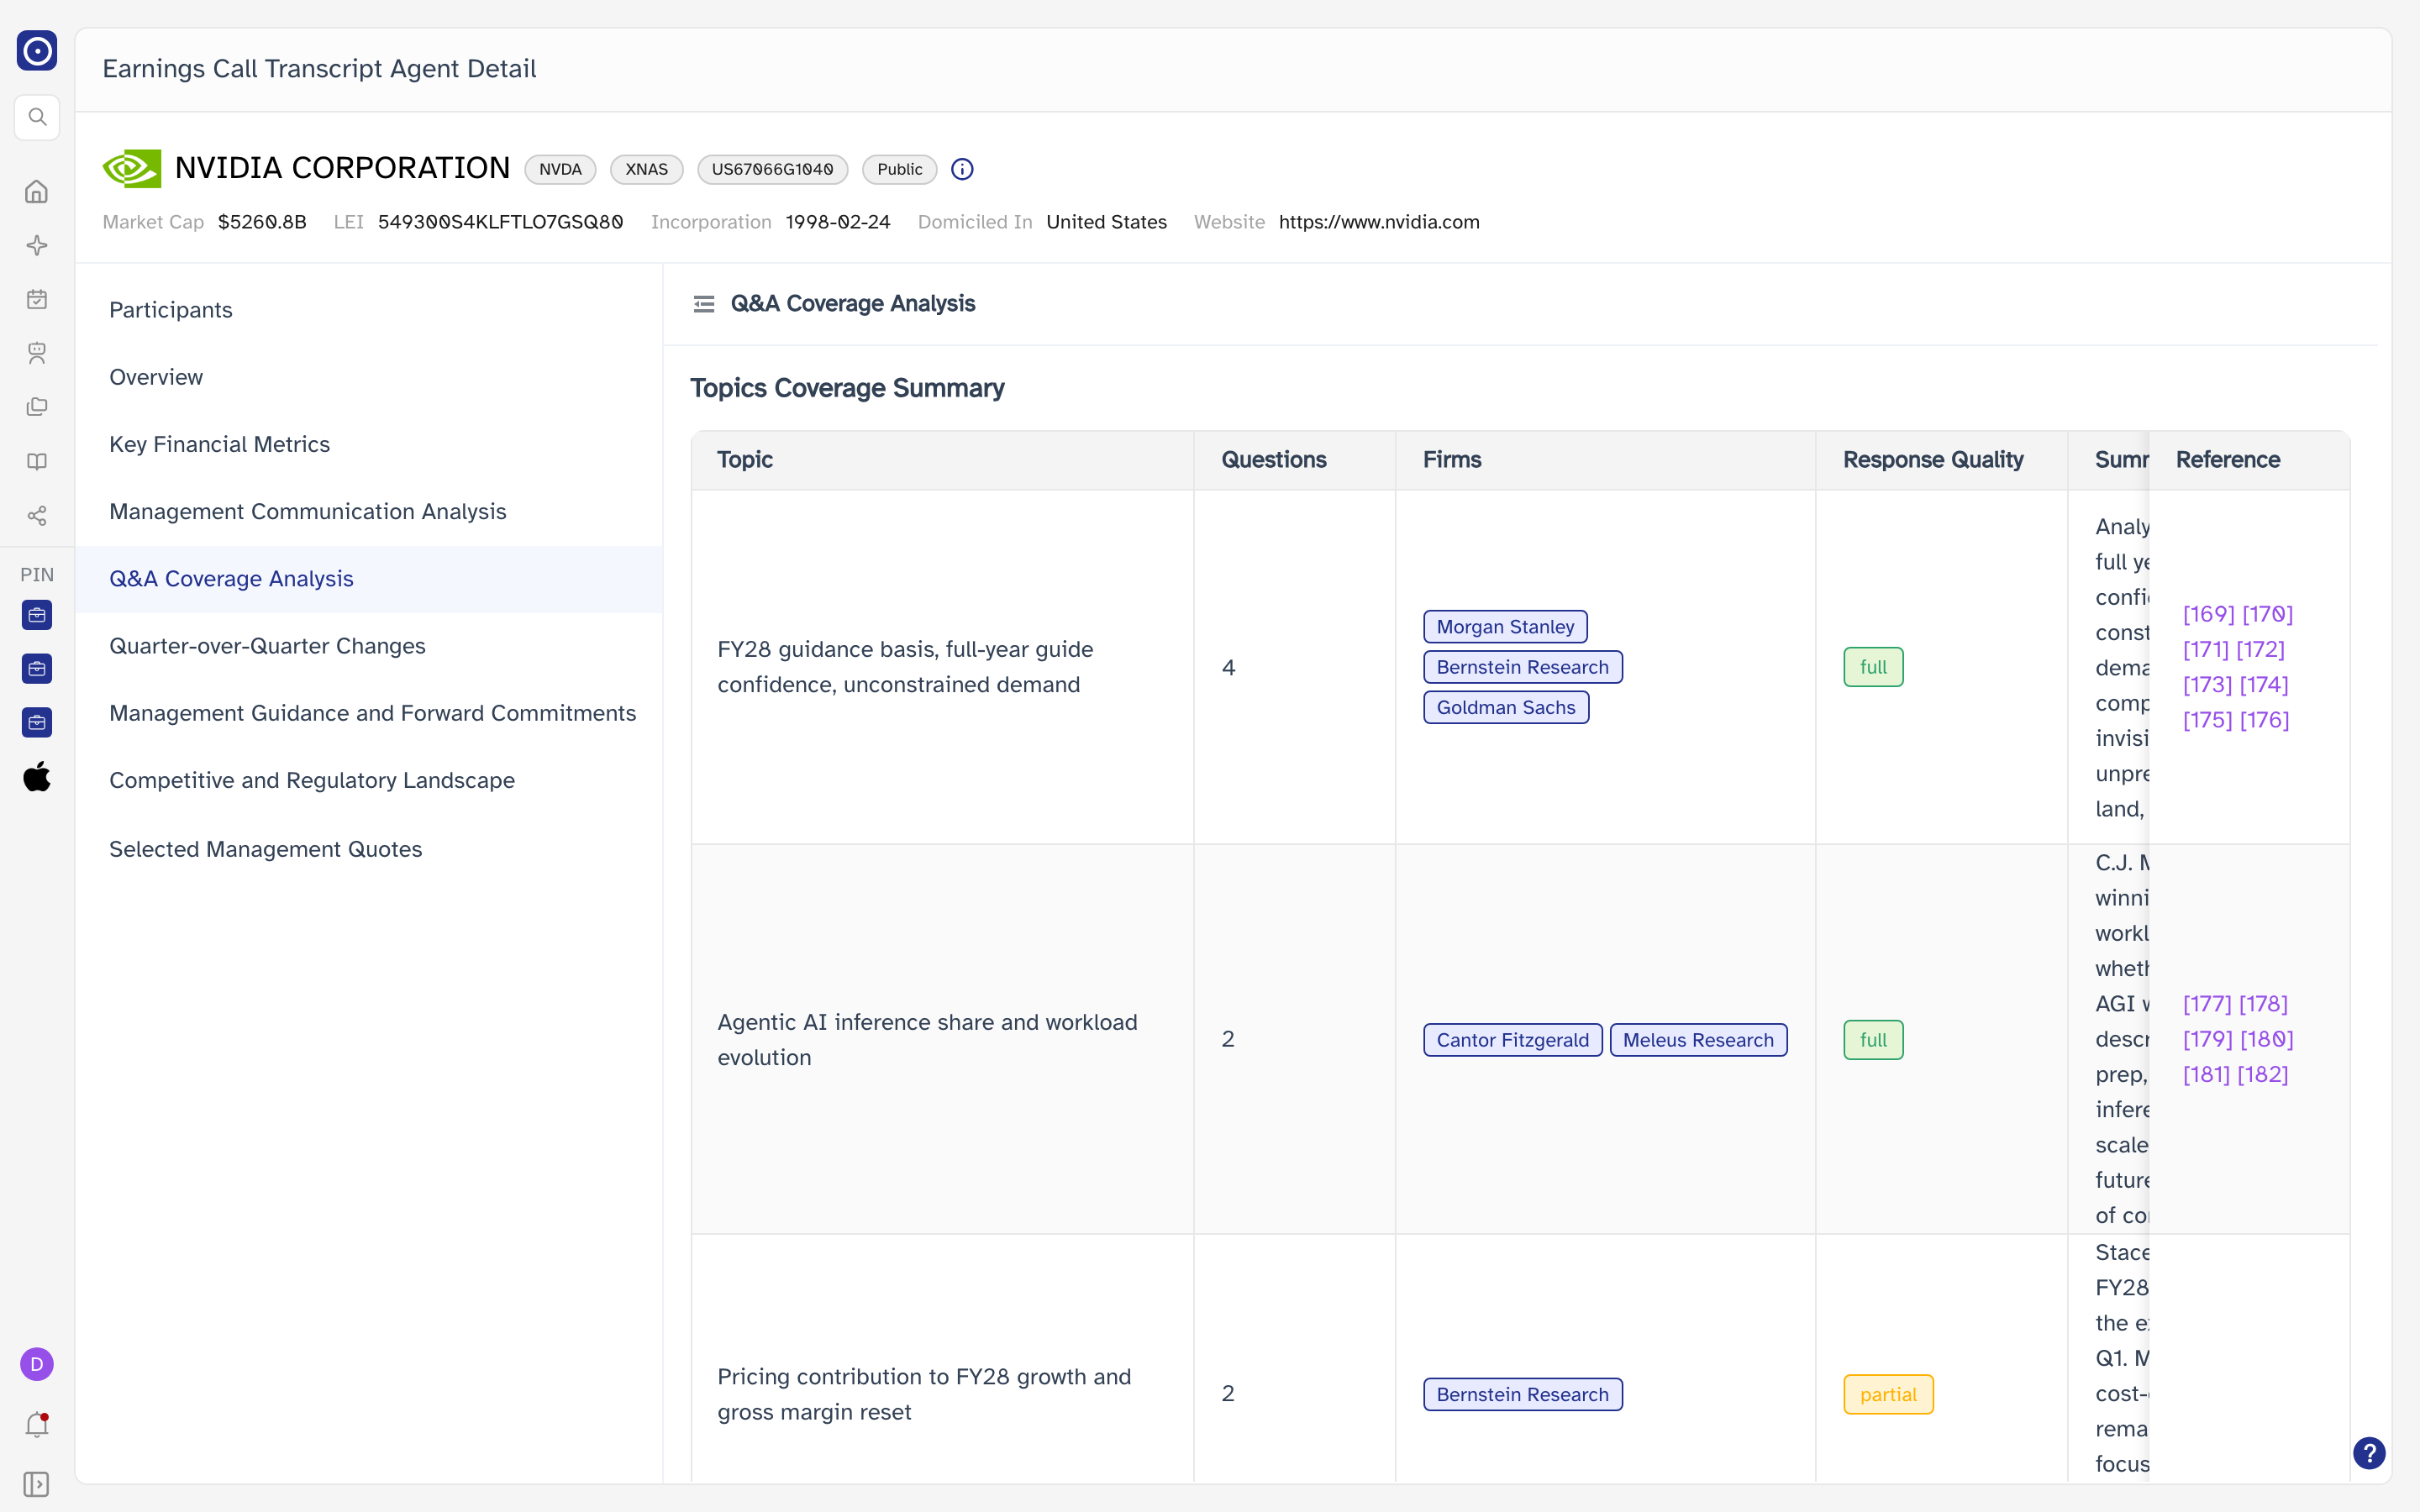
| Q&A Coverage Analysis | The questions analysts put, grouped by topic, with the firms that raised them and how fully they were answered. |
| Quarter-over-Quarter Changes | What moved since the previous call. |
| Management Guidance and Forward Commitments | What management promised, and what they had promised last time and delivered. |
| Competitive and Regulatory Landscape | Competitors and regulation as management described them. |
| Selected Management Quotes | Lines worth quoting, with the sentiment behind each. |
A section with nothing to report shows No Data rather than being hidden, so an empty Selected Management Quotes means the call had no line worth pulling out — not that the page failed to load.
Overview
Key Financial Metrics
Management Communication Analysis
Q&A Coverage Analysis
Reading against the original transcript
Numbers in square brackets — [1], [2] and so on — point at the
place in the original transcript the statement came from. They appear beside every extracted
figure, phrase and verdict.
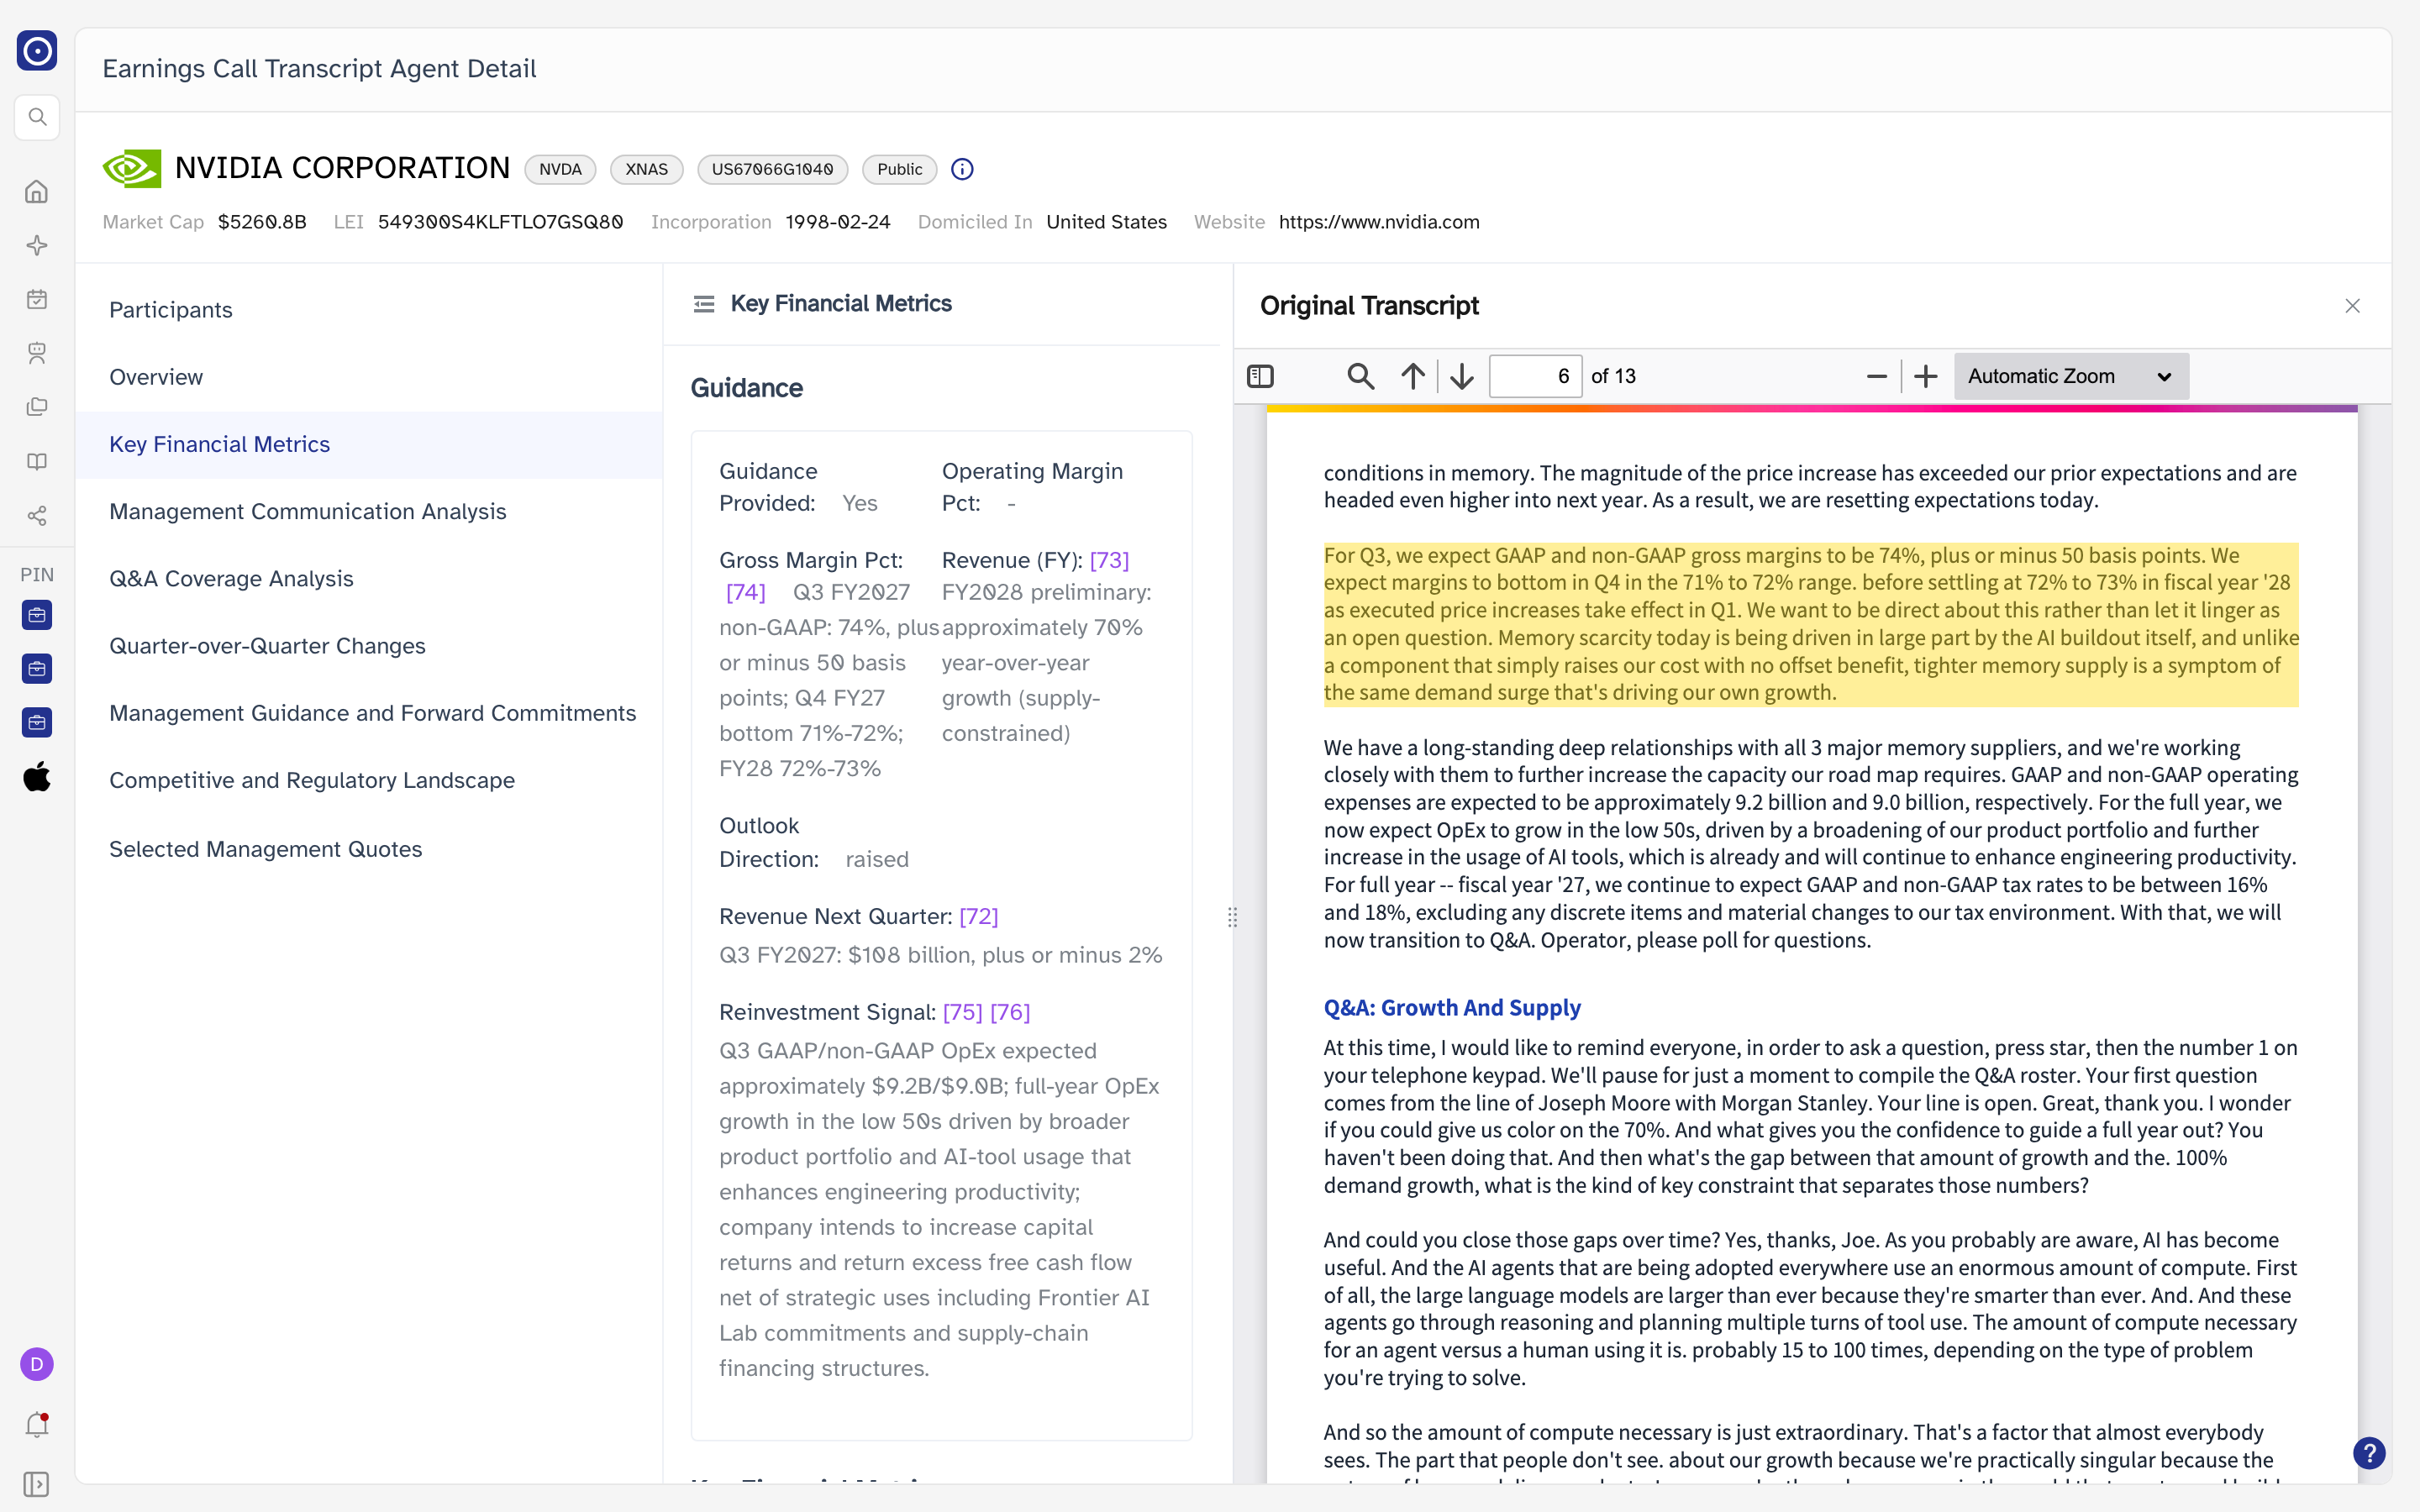
Clicking a second reference moves the same panel rather than opening another one. When a call has more than one source document, a dropdown appears in the panel header listing them by file name so you can switch between them.
The highlighted document is served from Orbit's document host. If your network blocks it, the write-up on the left still works — only the transcript panel comes up empty.
What to do next
The fastest way to make this page useful is to filter it by a Portfolio — then the list only carries the companies you already track, and each new quarter shows up beside the last one.